


January 26, 2023 6:29 AM

The United States Core Personal Consumption Expenditure Price Index (Core PCE) is said to be the Fed’s favorite measure of inflation, as it captures the most meaningful data for the Fed, without food and energy. On Friday, the US will release December’s Core PCE. Expectations are for the inflation reading to be 4.4% YoY vs a November reading of 4.7% YoY. If the print is in line with expectations, it will be the 4th consecutive monthly fall in inflation. But what will that mean for the Fed?
Expectations have already fallen for the FOMC when it meets next week. After the December meeting, markets were pricing in a 50bps hike for February. However, after worse than expected economic data was released throughout January, expectations were lowered on recession fears. Average Hourly earnings for December fell dramatically. CPI in December MoM declined for the first time since May 2020. Retail Sales, Industrial Production, and Manufacturing Production were all negative and lower than expectations. Many think the housing market is already in a recession. Yet, Fed members have marched out during January with comments pointing to a 25bps hike on February 1st. According to the CME Fedwatch tool, markets are pricing in a 100% chance of a 25bps rate hike.
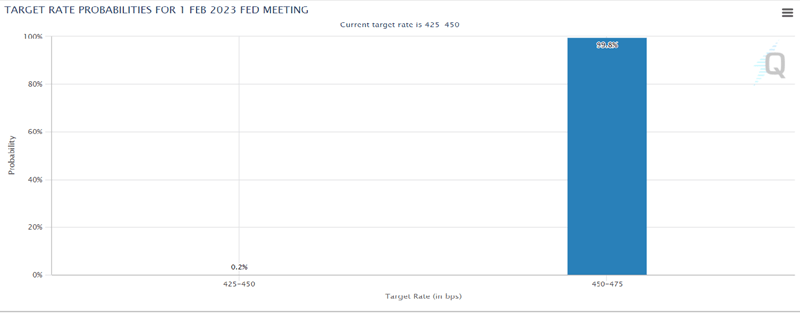
Source: CME
The Bank of Canada raised rates by 25bps on Wednesday and said it was pausing its rate hike cycle to assess whether monetary policy is sufficiently restrictive. Canada’s Inflation Rate is 6.3% YoY. Australia just released its RBA Trimmed Mean CPI, and it was 6.9% YoY. What if the Core PCE for December is weaker than the 4.4% YoY expectation? Will it make a difference to whether the FOMC hikes 25bps? Could the FOMC surprise markets and leave rates unchanged? Perhaps it may signal a pause, ala the BoC. Regardless of whether the Core PCE is weaker or stronger, the Fed’s rate hiking cycle is close to done.
Everything you need to know about the Federal Reserve
This may help explain why the US Dollar has been weak vs the Euro. EUR/USD has been trending higher since the weak Average Hourly Earnings were released on January 6th. On a 240-minute timeframe, the pair bounced off the bottom trendline of a rising channel. For the last 2 weeks, EUR/USD has been oscillating around the top trendline and is forming an ascending wedge. If the markets continue to believe the Fed will be dovish (or if the ECB continues to be more hawkish) price should continue to rise in the ascending wedge as we approach the FOMC meeting. Previous highs from April 21st, 2022 cross just above at 1.0936. However, if the market decides to take profits ahead of the Fed (remember, the Fed is in the blackout period), then EUR/USD may move lower. Note that the expectation is that price will break lower from an ascending wedge and retrace 100%, or to 1.0766. Below there, EUR/USD could fall back to the bottom trendline of the channel and horizontal support near 1.0635.
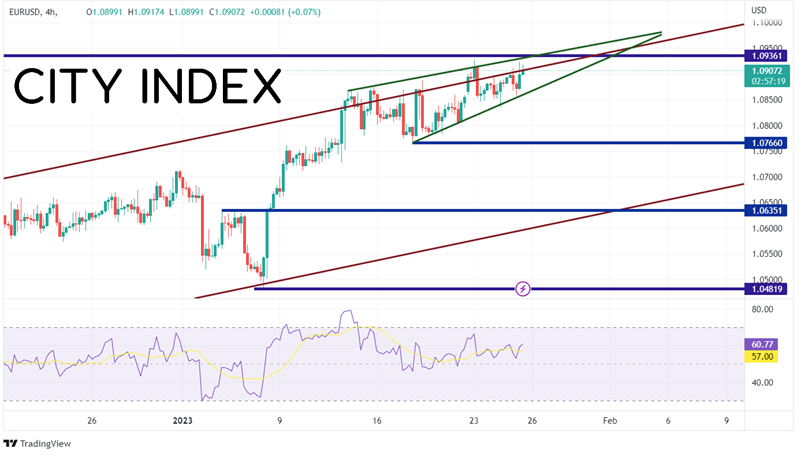
Source: Tradingview, Stone X
Trade EUR/USD now: Login or Open a new account!
• Open an account in the UK
• Open an account in Australia
• Open an account in Singapore
The Fed’s favorite measure of inflation, Core PCE, will be released on Friday. Expectations are for the index to rise by only 4.4% YoY. Note that the Fed targets 2% inflation. If the print is “as expected”, will this be enough of a drop for the Fed to leave rates unchanged at its February meeting? Perhaps, at the very least, it would lead the Fed to signal a pause in March. But if its stronger than expected, as was Australia’s CPI earlier today, watch for the Fed to increase 25bps and maintain its 25bps rate hikes “as needed”.
Learn more about forex trading opportunities.
Latest market news
Yesterday 01:32 PM
Yesterday 09:35 AM
Yesterday 07:23 AM
Yesterday 04:48 AM
Yesterday 12:17 AM
July 25, 2024 10:39 PM
Latest Trade Ideas articles

Yesterday 09:35 AM

Yesterday 12:17 AM

July 25, 2024 10:39 PM

July 25, 2024 05:30 PM