
S&P500 Forecast: SPX rebounds as big tech recovers & inflation is in focus
Article
Today 11:32 PM


The daily fluctuations on a chart can appear to be random or even noisy. One way to filter this out is by using moving averages. This is one of the most commonly used modes of technical analysis and a simple indicator in a trader's toolbox.
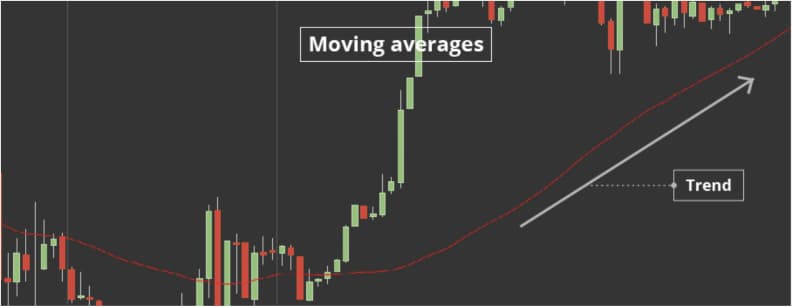
Moving averages are often utilised to determine the trend in volatile markets.
There are many types of MAs and traders typically use more than one to determine market momentum. The most popular are the Simple Moving Average (SMA) or the Exponential Moving Average (EMA).
A moving average is calculated by totaling a set of prices over a set period of time and then dividing the sum by the number in the series. The prices could be the closing price of an instrument and the number could be the number of days or bars used in the calculation.
To calculate a simple 5 day moving average of the closing price, the following formula can be used:
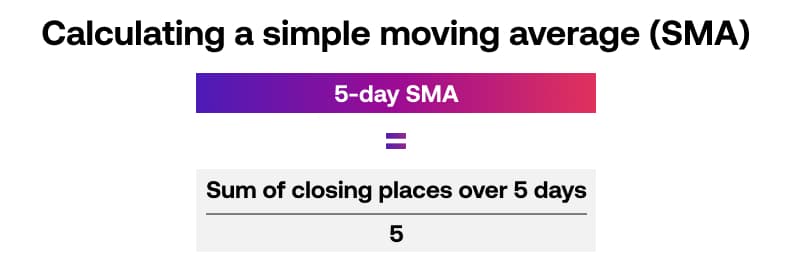
Today being day five's closing price is added to the previous day's closing prices which are added to the previous day. The series updates as time moves forward and always using the current day's closing price.
The five day MA is not set in stone. Traders can choose different time periods and the most popular ones in use are the 10 day, 20 day, 50 day, 100 day and 200 day moving averages.
In its simplest form a market can be considered bullish when trading above the moving average and bearish when trading below the moving average.
What signals to look for:
Moving averages can be used over multiple timeframes ranging from minutes, hours, days and weeks. The common time frames are daily for short term traders and weekly for longer term traders.
This indicator is useful for traders who are seeking to trade with the trend and stay in trades from an intermediate to longer term timeframe.
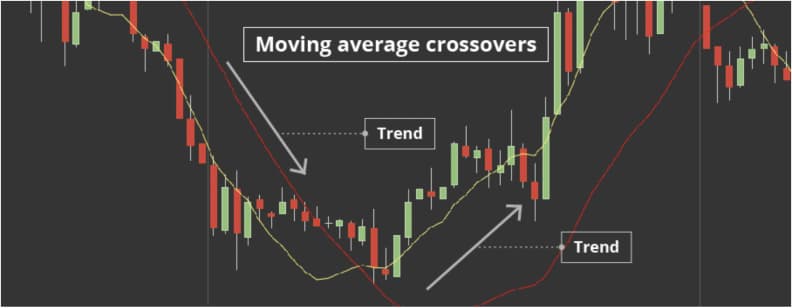
The Moving average indicator can also be used with a crossover technique.
With this technique two or more moving averages are used and when the slower moving average crosses over the other one, a signal to enter or exit is initiated.
When an SMA with a short-term time period (for instance, a 15-day SMA) crosses above an SMA with a long-term timeframe (a 50-day SMA), it usually means that the market is in an uptrend.
When an SMA with a shorter time period crosses below an SMA with a longer time period, it usually means that the market is in a downtrend. Traders also use SMAs to detect areas of support when a trend changes direction. Generally, an SMA with a longer time period identifies a stronger level of support.
Example
A trader decides to use two moving averages of varying periods. Typically a 15 period crossing over a 50 period is often used for traders seeking to capture a trend over a period of weeks. When the 15 period crosses above the 50 period this can be considered bullish. A trader would enter a long position and stay with the position until the 15 period crosses below the 50 period moving average where they would either exit or reverse their long position to a short position.
Different traders use different settings and of course different time frames to suit their needs.
Like the SMA, Exponential moving average (EMA) combines the closing prices of an instrument over a specific time frame and averages that value by the number of time frames. With EMAs, however, the calculation gives more weight to the most recent prices.
If prices change, EMAs generally react more quickly than other moving averages. That's one of the reasons why it's used to create other indicators, like the Moving Average Convergence Divergence (MACD). Some short-term traders use 12- and 26-day EMAs, while long-term traders prefer to use 50- and 200-day EMAs.
The Moving average convergence divergence or MACD for short helps traders forecast when to enter or exit a trade. Based on the Exponential Moving Average (EMA) indicator, this trend-following indicator can also be used to determine the underlying momentum behind a trend.
A MACD comprised of three components:
It measures the difference between the fast EMA and slow EMA and provides buy and sell signals on crossovers of the two EMA lines as well as above or below the zero line.
The MACD is shown in a chart below the normal one. It also displays a histogram, which represents the difference between the MACD and the signal lines. With the MACD, traders watch for several types of movements.
The MACD is a versatile indicator and can be used in multiple ways. Traders can use the MACD to enter as part of a trend or event to see if a trend is coming to an end.
There are three essential techniques of MACD use, and each of these are described below. Using the Moving Average Crossovers, or using the zero line, are the most popular techniques, but also watching for divergences can provide suitable trading signals.
One of the most common techniques with the MACD is to wait for the fast EMA to cross above the slow EMA for a buy signal (to enter a long position). Traders would expect a rising market with this signal. Alternatively, when the fast EMA crosses below the slow EMA then a trader could consider a sell signal to enter short and expect the market to fall.
Some traders prefer to wait for the MACD to have crossed over and also cross above the zero line for a bullish signal. If the MACD has crossed from above to go below the zero line, then this would be considered a bearish signal.
If the market is rising and forming higher highs but the MACD indicator has not followed suit, then this may indicate that a divergence is setting up. Simply put this means that both the market and the indicator are out of sync, one is not in agreement with the other. When a divergence takes place a possible reversal may be at hand.
The MACD can be used on multiple timeframes ranging across minutes, hours, days and weeks. The common time frames are daily for short term traders and weekly for longer term traders. Some traders use the MACD on intraday timeframe charts to capture very short term moves lasting from minutes to hours.
This indicator is useful for traders who are seeking to trade with the trend and stay in trades from generally an intermediate to longer term time frame.