


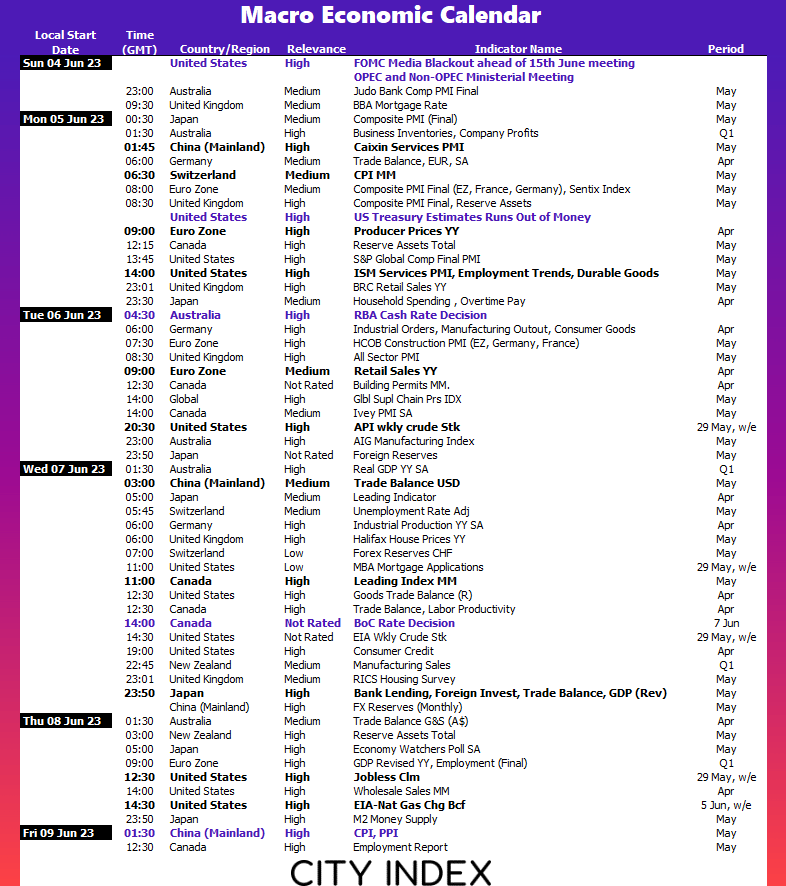
We could be off to a quiet start to the week as public holidays in the UK and US will see key trading hubs closed on Monday. But whilst low-liquidity sessions can be quiet, they can also provide uncomfortable levels of volatility should an unexpected catalyst arrive, as it requires less effort to move a low-liquidity market. With that said, the debt-ceiling is on track to be raised which resulted in strong rally for risk assets such as the Nasdaq and S&P 500 on Friday, ahead of the long weekend. Beyond that we have final PMI data for Asia, Europe and the US, key inflation data for Australia to aid them with their next ‘finely balanced’ rate decision in June. And with traders increasing bets of a 25bp Fed hike, eyes will be focussed on employment data ahead of Friday’s NFP, which includes JOLTS job openings, Challenger layoffs and the ADP employment report.
The week that was:
- Debt ceiling negotiations dragged on as expected but finally made it to a vote, past the Republican House and is now wit the Democratic Senate for a vote (at the time of writing)
- Whilst higher PCE inflation last week saw bets for a Fed June hike rejuvenated, the Fed’s Vice Chair Jefferson hinted at a pause in June but also warned it may not be the end of the tightening cycle
- A host of softer than expected inflation prints from Spain, France and Germany helped push the euro down to a 3-month low
- Yet hawkish comments from ECB President Lagarde combined with dovish comments form some Fed members saw EUR/USD promptly reverse the week’s losses
- Tech stocks were the clear winners of Wall Street in May with the Nasdaq rising to a 13-month high (view the monthly candles of major indices for May)
- The Hang Seng entered a technical bear market (20% lower from its previous peak)
- China’s manufacturing PMI contracted for a second month and at its fastest pace in six, whilst services PMI fell to a 4-month low
- Australian inflation was uncomfortably strong at 0.5% m/m and 6.8% y/y, which keeps the pressure on the RBA to hike on Tuesday
- Inflationary pressures continued to cool with the CRB commodities index closing at a 16-month low
The week ahead (calendar):
Earnings This Week
Look at the corporate calendar and find out what stocks will be reporting results in Earnings This Week.
The week ahead (key events and themes):
- Public holidays in the US, UK on Monday
- Appetite for risk to rise with the debt ceiling?
- US employment data (Nonfarm payroll, layoffs, JOLTS and claims data)
- Australian inflation report
Public holidays in the US, UK on Monday
Whilst a public holiday is not a trading event within itself, it does mean key exchanges in the UK and US will be closed, and trading volumes will be lower for markets (such as forex and some futures) will be lower. And that can be a double-edged sword. Mondays can be quiet (particularly in Asia) but volatility could also be suppressed more than usual due to a lack of economic data being released and fewer market participants. Yet the flip side is that volatility can erupt and become larger than life should a large macro event occur, as it takes less effort to move a market when liquidity is low. And one potential theme is the debt ceiling being raised (assuming it has not occurred ahead of the weekend, bearing in mind this article has been written in Asia ahead of the European and US open).
S&P bears may have been 'caught short' with their extreme positioning
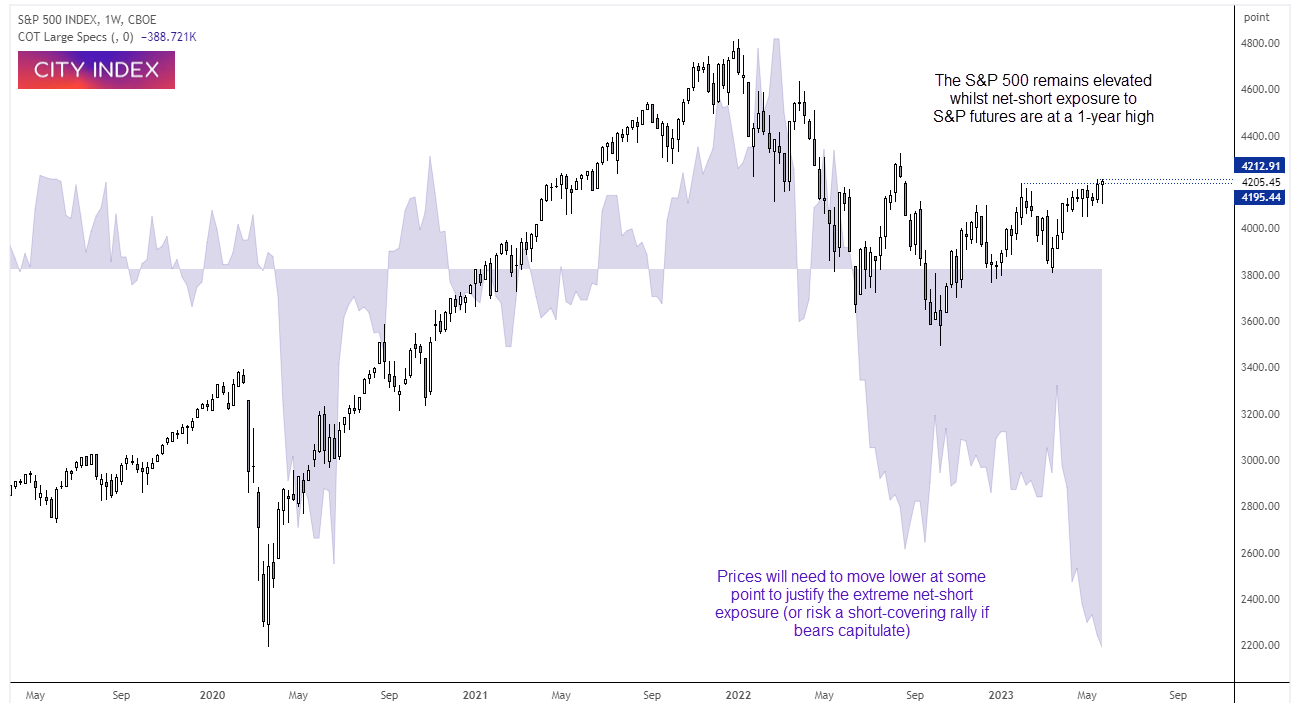
After much toing froing this week, we finally saw Wall Street erupt higher on believable hopes that a debt ceiling will in fact be raised. And that could be bad news for high level of bearish bets on the S&P 500, with net-short exposure at a 12-year high as of last Tuesday. The S&P 500 is on the cusp of breaking above its YTD high and breaking above 4200, and with that comes the risk of a short-coving rally as bears hide for cover and add fuel to a bullish fire.
US data (Nonfarm payroll, layoffs, JOLTS and claims data)
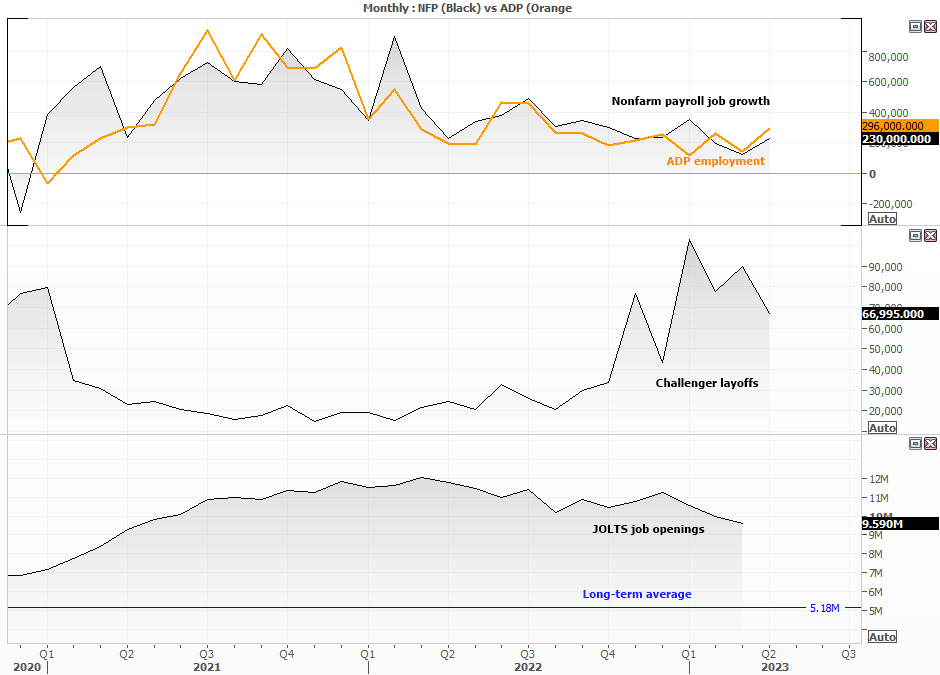
With traders coming around to the idea that the Fed might not pause again in June, employment data (and economic figures in general) will remain to be closely scrutinised. JOLTS job openings may have peaked in March 2022, but it still remains high at 6.9 million relative to its long-term average of 5.2 million to show strong demand by employers. Unless we see this drop suddenly on Wednesday then it could support another Fed hike.
Layoffs, jobless claims and ADP employment figures are then released on Thursday as a warm-up for Friday’s Nonfarm payroll report. And unless we see material weakness in any of thee data points, the job market will likely remain to be deemed as ‘tight’ by the Fed and support the US dollar in anticipation of another hike or two for this cycle.
Australian inflation report
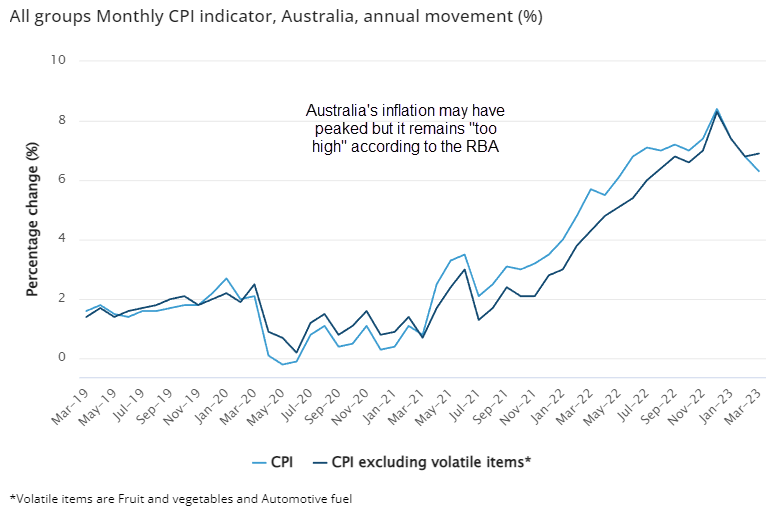
The RBA surprised with a 25bp hike after a single meeting with a pause to take rates to 3.85%. Governor Lowe later cited ‘high inflation’ and the minutes revealed the decision was ‘finely balanced’, to serve as a reminder that the RBA is very much data dependant between meetings. And that puts Wednesday’s inflation report on trader’s radars.
We know that the RBA are concerned with services inflation rising, but unfortunately for the ABS (Australian Bureau of Statistics) do not provide a direct read of those consumer prices. But a short-cut is to keep an eye on electricity prices and rents, as these are non-tradable items that are not impacted by international trade and are a staple part of a household budget.
With May’s figures revealing electricity to have risen 15.7% y/y and rents at a high of 5.7% y/y, we (and the RBA) would like to see some softness here to be sure they won’t hike again.
With that said, they may have some wriggle room to pause again following the RBNZ’s decision to signal a peak rate of 5.5% and slight softness in Australia’s recent employment report.
-- Written by Matt Simpson
Follow Matt on Twitter @cLeverEdge
How to trade with City Index
You can trade with City Index by following these four easy steps:
-
Open an account, or log in if you’re already a customer
• Open an account in the UK
• Open an account in Australia
• Open an account in Singapore
- Search for the market you want to trade in our award-winning platform
- Choose your position and size, and your stop and limit levels
- Place the trade
Latest market news
Yesterday 01:32 PM
Yesterday 09:35 AM
Yesterday 07:23 AM
Yesterday 04:48 AM
Yesterday 12:17 AM
July 25, 2024 10:39 PM
Latest Week ahead articles

Yesterday 04:48 AM

July 19, 2024 06:20 AM

July 12, 2024 01:32 AM
July 12, 2024 01:32 AM