


Monday US cash market close:
- The Dow Jones Industrial rose 406.39 points (1.17%) to close at 35,131.86
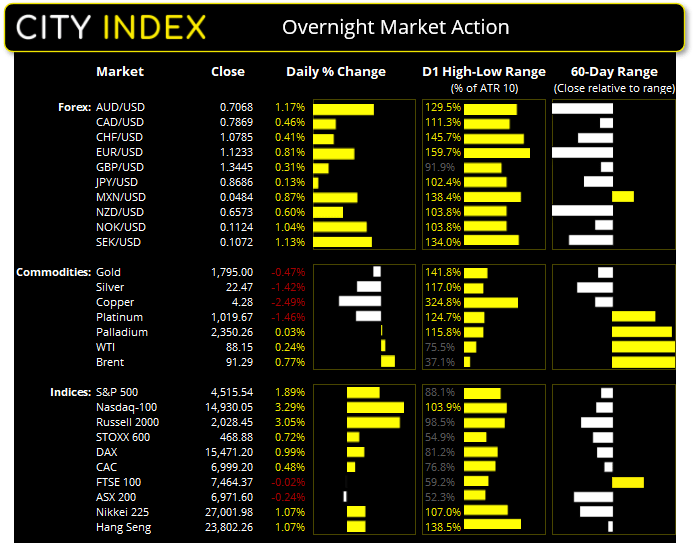
- The S&P 500 index rose 83.7 points (1.89%) to close at 4,515.55
- The Nasdaq 100 index rose 475.441 points (3.29%) to close at 14,930.05
Asian futures:
- Australia's ASX 200 futures are up 42 points (0.61%), the cash market is currently estimated to open at 7,013.60
- Japan's Nikkei 225 futures are up 250 points (0.92%), the cash market is currently estimated to open at 27,251.98
- Hong Kong's Hang Seng futures are down 0 points (0%), the cash market is currently estimated to open at 23,802.26
- China's A50 Index futures are up 121 points (0.82%), the cash market is currently estimated to open at 14,890.78
The days leading into the month-end can be notorious for whipsaws and volatility as traders adjust their books. Yet as volatility was high leading into month end anyway the biggest takeaway from yesterday’s rally on Wall Street is that bears likely book profits to help markets clear their recent volatile ranges. The Nasdaq-100 rallied 3.3% to a 7-day high an trade just shy of 15k, the S&P rose 1.8% and the DJI 1.2%.
The Fed aren’t concerned with triggering a recession
The Fed don’t seem too concerned about them triggering a recession with Bostic describing its possibility as “relatively far off” and Barkin later saying it’s not their core focus when demand remains so strong. Barkin also highlighted his expectation for a slightly lower employment repot in January but remains hopeful it will pick up in February and March, and to expect “a few” hikes in hand with the reduction of their balance sheet.
Everything you need to know about the Federal Reserve
The dollar’s rally reverses on last day of the month
A combination of end-of-month flows and the temptation to book profits after a decent rally saw the US dollar move broadly lower yesterday. The US dollar index re-tested Thursday’s low and fell around -0.6%, although much of the move was powered by a stronger euro after better-than-expected GDP data for the eurozone. Growth rose at 4.6% y/y in Q4 (up from 3.9% in Q3) although on the quarter it rose 0.3% (down from 2.2%).
NZD and AUD were the weakest majors in January
January was not kind to antipodean currencies with NZD and AUD falling -3.9% and -2.8% respectively against the US dollar, which was joint place the strongest currency alongside the Japanese yen. Obviously, the stronger dollar was the key theme around a hawkish Fed. Yet Wall Street’s rally and month-end flows saw a sharp reversal for AUD and NZD as they tracked sentiment higher.
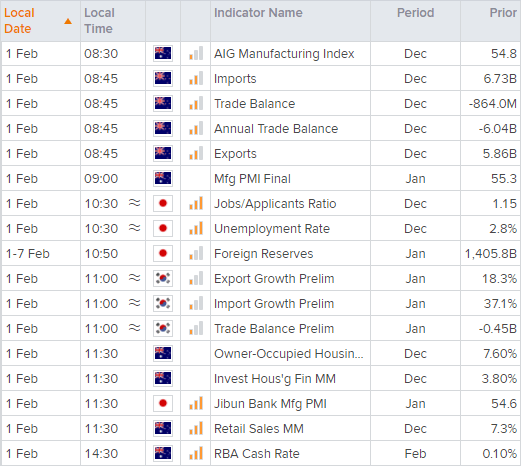
RBA’s meeting is the key event today at 11:30 AEDT, where the RBA are expected to end their QE program and bring forward expectations of a hike. AUD/USD was the strongest pair of the 28 we track and would have formed a bullish engulfing candle, had it not gapped up slightly at the open. However, it remains at the mercy of the US dollar and whilst it remains below 0.7100 the potential for another dip lower is apparent.
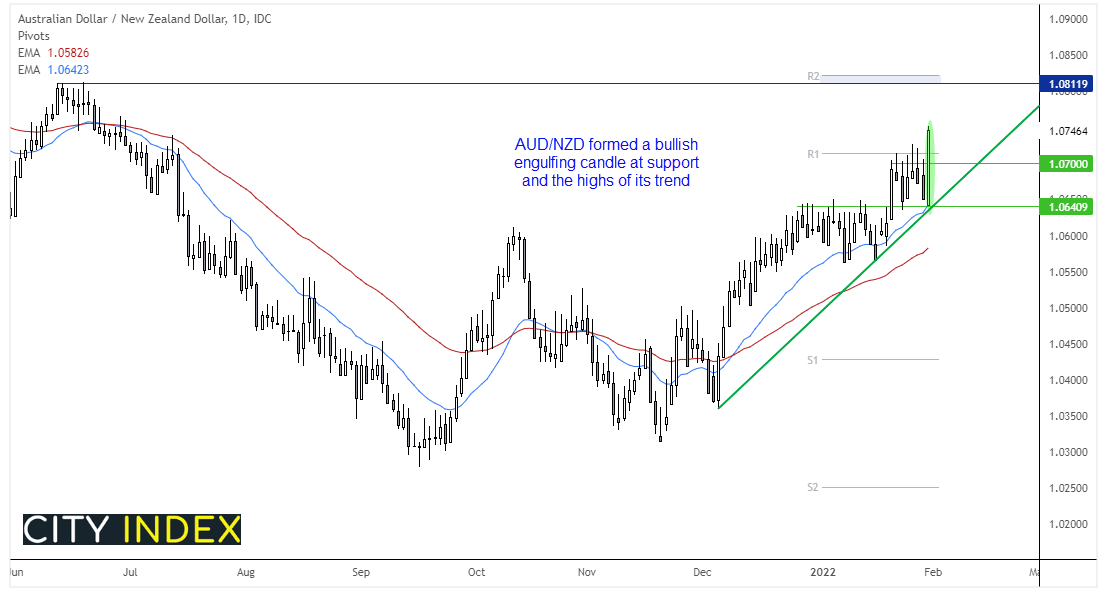
However, from a technical perspective AUD/NZD seems more appealing. It has carved out a decent trend on the daily chart along its trendline, and yesterday closed with a bullish engulfing candle at the trend highs. Furthermore, the engulfing candle bounced from the 20-day eMA. With highs around 1.0800 making its next obvious target we’d need to manage risk above 1.0700 to make the reward/risk viable. Therefore, as long as prices remains above 1.0700 / trendline we favour a run to 1.0800.
Read our guide on the Australian Dollar
Gold retested 1800 (from underneath)
Gold saw the bounce to 1800 but lacked the enthusiasm to break above it, and closed the day with a bullish inside candle. Still, this can be indicative of pending volatility and with real yields remaining lower form last week’s highs it still leaves the potential for an upside break of 1800 and its 200-day eMA.
Can ASX 200 track Wall Street higher?
Possibly, but we wouldn’t hang our hats on it until we see prices break above 7043. Until then we’re on guard for another dip lower, especially if it moves further below 7,000.
ASX 200: 6971.6 (-0.24%), 28 January 2022
- Information Technology (3.69%) was the strongest sector and Financials (-1.83%) was the weakest
- 6 out of the 11 sectors closed higher
- 5 out of the 11 sectors closed lower
- 8 out of the 11 sectors outperformed the index
- 57 (28.50%) stocks advanced, 133 (66.50%) stocks declined
Outperformers:
- +8.8% - Telix Pharmaceuticals Ltd (TLX.AX)
- +8.2% - Genesis Energy Ltd (GNE.AX)
- +7.9% - ARB Corp Ltd (ARB.AX)
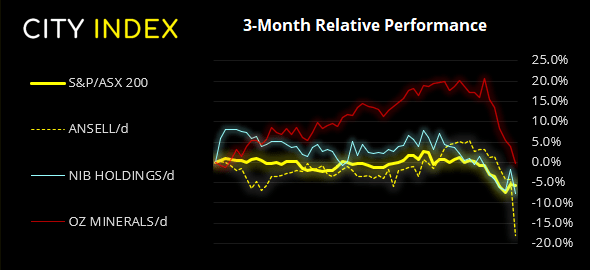
Underperformers:
- -14.4% - Ansell Ltd (ANN.AX)
- -6.03% - NIB Holdings Ltd (NHF.AX)
- -3.97% - OZ Minerals Ltd (OZL.AX)
Up Next (Times in AEDT)
How to trade with City Index
You can easily trade with City Index by using these four easy steps:
-
Open an account, or log in if you’re already a customer
• Open an account in the UK
• Open an account in Australia
• Open an account in Singapore
- Search for the company you want to trade in our award-winning platform
- Choose your position and size, and your stop and limit levels
- Place the trade
Latest market news
Yesterday 01:32 PM
Yesterday 09:35 AM
Yesterday 07:23 AM
Yesterday 04:48 AM
Yesterday 12:17 AM
July 25, 2024 10:39 PM
Latest Trade Ideas articles

Yesterday 09:35 AM

Yesterday 12:17 AM

July 25, 2024 10:39 PM

July 25, 2024 05:30 PM