


For much of this year I have been able to keep ahead of the US dollar’s moves simply by assessing the gap between the market’s expectations of multiple Fed cuts, compared with the unlikely event the Fed were to become as dovish as they intended. The dynamic was quite simply; as fewer cuts were gradually priced in, yields and the US dollar rose on the ‘higher for longer’ narrative.
Yet now markets have all but given up on cuts this year and the Fed have realised they’re in no rush to cut, the gap between market pricing and Fed expectations has vanished. And the dynamic has now changed.
The US dollar and yields continue to share a positive correlation, but yields and the US dollar are actually lower since Jerome Powell effectively poured cold water imminent rate cuts.

So what happened to ‘higher for longer = stronger yields and dollar’?
If yields are lower, it means investors are scooping up bonds. And if bond investors suspect the Fed are taking the fight against inflation more seriously via elevated rates, bonds could look attractive on the bet the tighter-for-longer policy will slow growth and inflation, and weigh on yields.
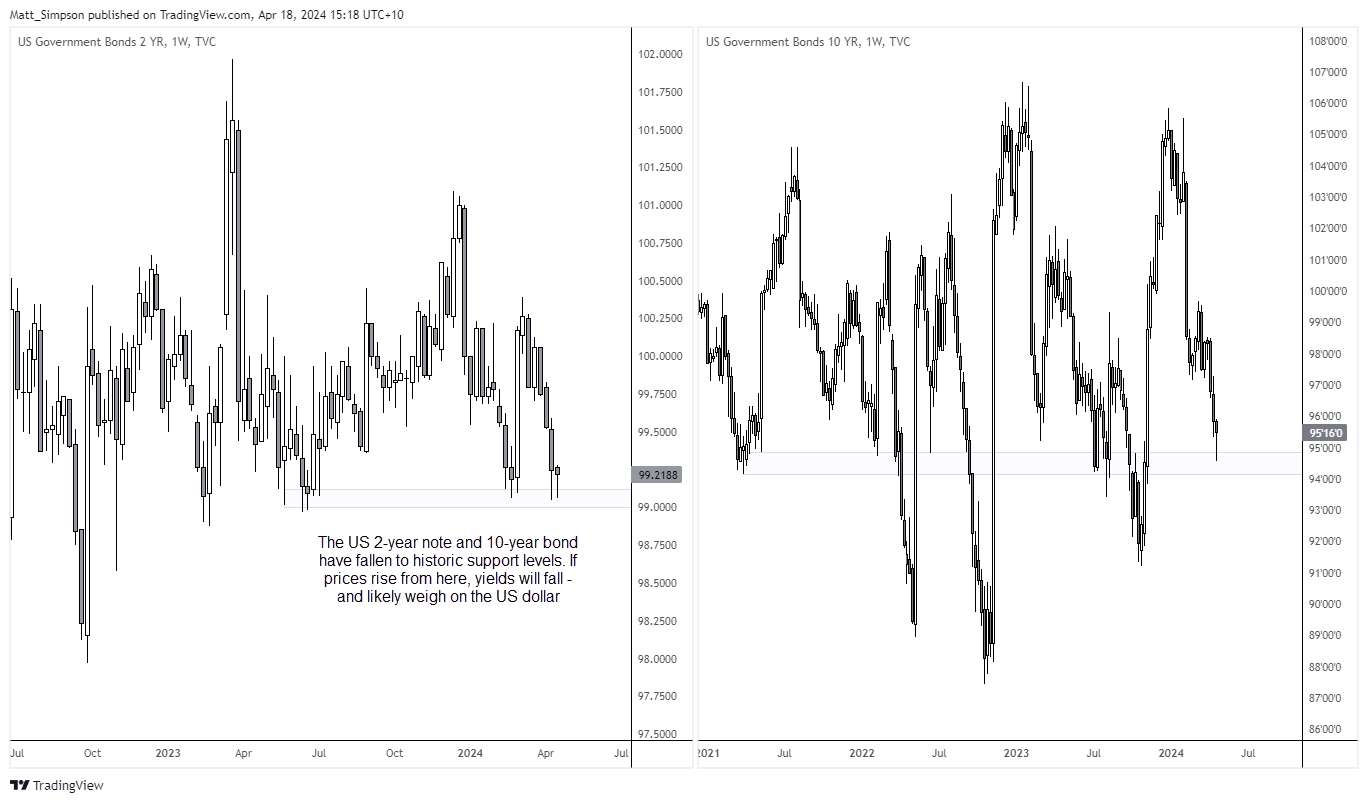
There may also be technical reasons for higher yields. As both the US 2-year note and 10-year bond have fallen to previous resistance levels. The 10-year is admittedly a tad spurious, but the 94-95 area has provided support on and off since 2021. And of bond investors are buying around support levels, it could send yields lower if bond prices retrace higher from here.
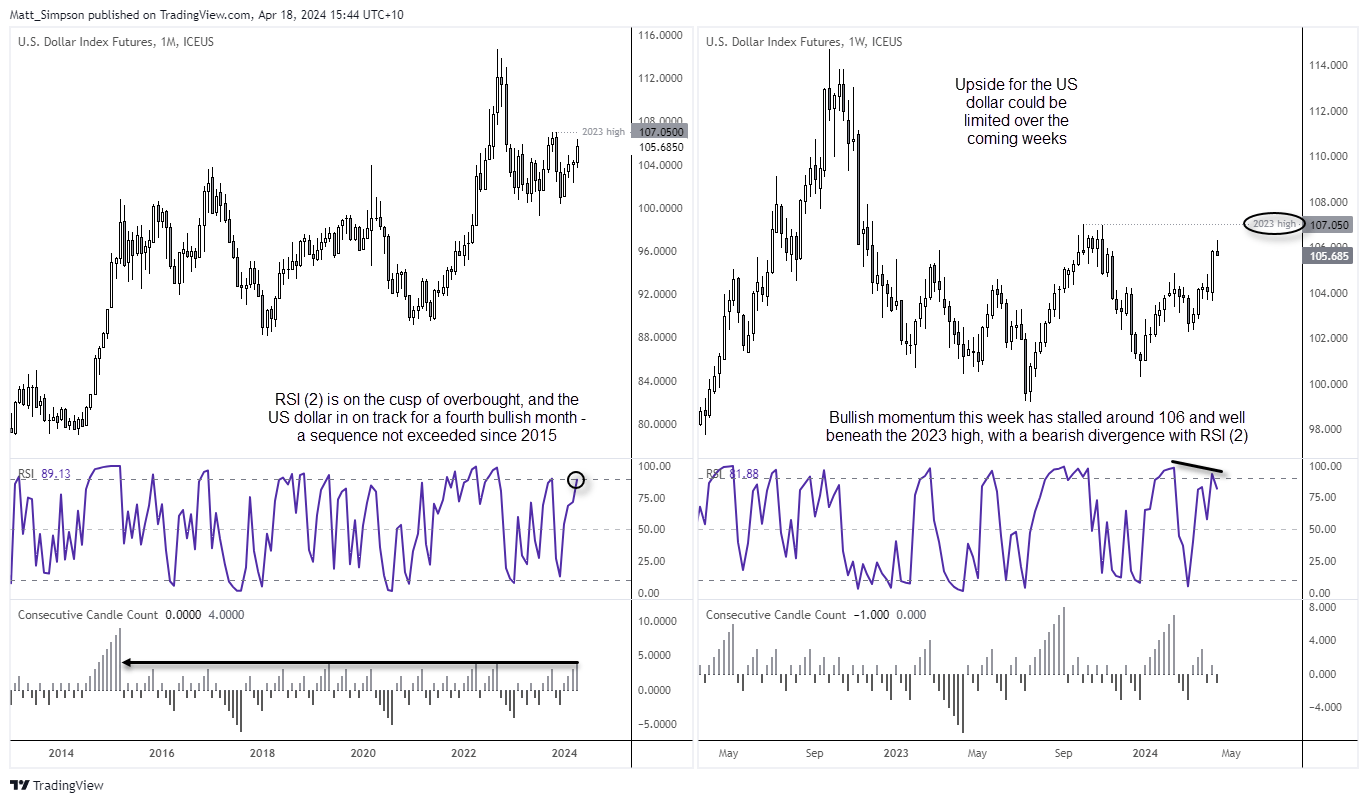
US dollar technical analysis (monthly and weekly chart):
Whilst April has averaged negative returns for the US dollar, it seems very unlikely to play out this year given the dollar has risen 1.3% month to date. Yet it is now within its fourth consecutive bullish month, a sequence it has not exceed since 2015. The monthly RSI (2) is also on the cusp of reaching overbought. A bearish divergence is forming on the weekly RSI (2), and momentum this week has waned around 106 – and well beneath the 2023 high.
Whilst none of this confirms an imminent top, I suspect we’re closer to the end of this leg higher than the beginning, or even the middle. Therefore, I will be seeking evidence of a swing high on the higher timeframes on the US dollar over the coming weeks.
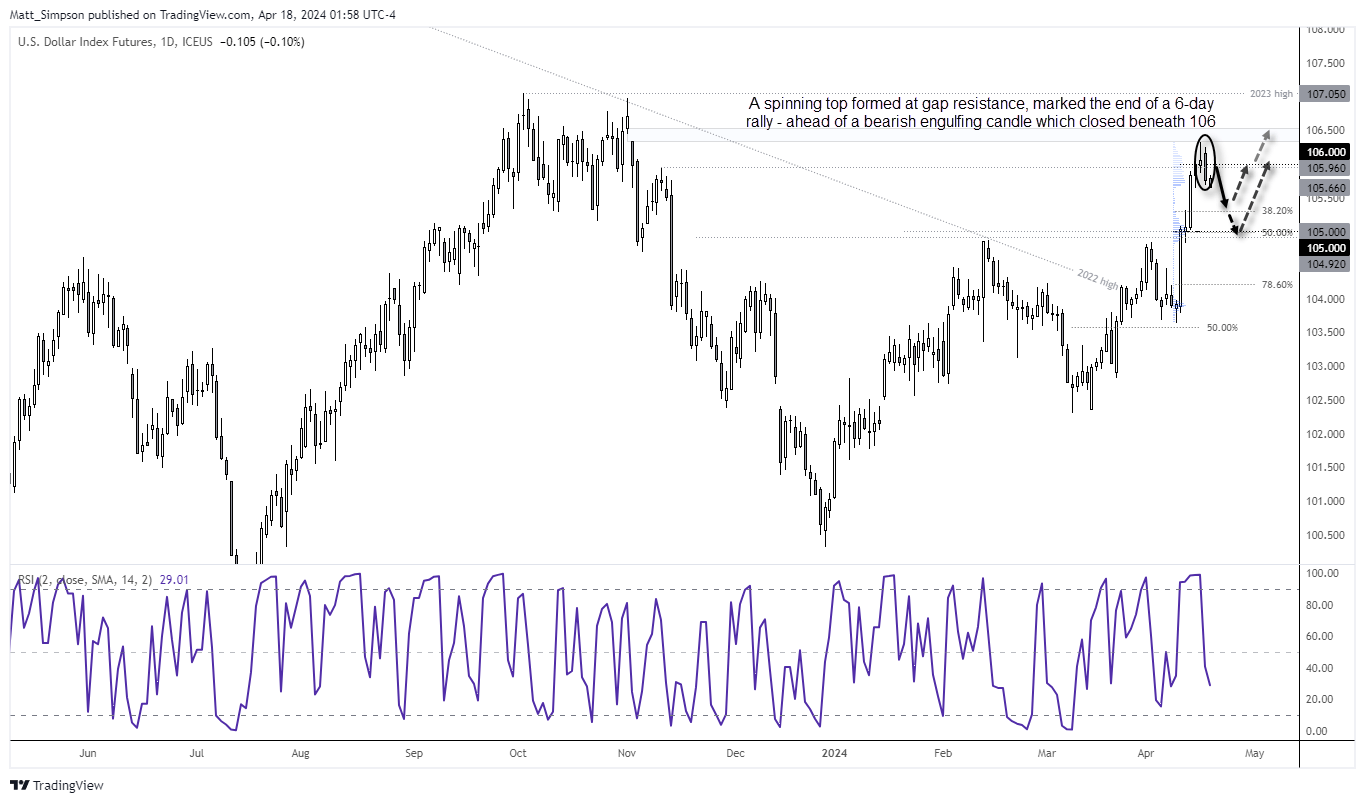
US dollar technical analysis (daily chart):
The daily chart shows that the US dollar index snapped a 6-day bullish streak on Wednesday, a sequence not achieved since September (which actually saw a 7-day rally). Its high perfectly respected the lower gap from late October and formed a spinning top doji, which was followed by a bearish engulfing candle. Momentum has turned lower in Thursday’s Asian trade, and the bias is for a move to at least 105.50.
Bears could seek to fade into minor rallies beneath the 106 handle, with 105.50, 105.30 (38.2% Fibonacci) and 105 (high-volume node and 50% level) in focus for bears.
-- Written by Matt Simpson
Follow Matt on Twitter @cLeverEdge
How to trade with City Index
You can trade with City Index by following these four easy steps:
-
Open an account, or log in if you’re already a customer
• Open an account in the UK
• Open an account in Australia
• Open an account in Singapore
- Search for the market you want to trade in our award-winning platform
- Choose your position and size, and your stop and limit levels
- Place the trade
Latest market news
Yesterday 01:32 PM
Yesterday 09:35 AM
Yesterday 07:23 AM
Yesterday 04:48 AM
Yesterday 12:17 AM
July 25, 2024 10:39 PM
Latest Trade Ideas articles

Yesterday 09:35 AM

Yesterday 12:17 AM

July 25, 2024 10:39 PM

July 25, 2024 05:30 PM