


March 10, 2022 3:04 AM
As markets see a glimmer of hope that there may be a ceasefire ahead in the Russia/Ukraine war, the US Dollar is giving back some of its recent gains after trading to its highest level since May 2020. On Monday, the US Dollar Index reached an intra-day high of 99.42, after testing the top trendline of an upward sloping channel it has been in since May 2021, horizontal resistance, and the 161.8% Fibonacci extension from the highs of January 28th to the lows of February 4th. The RSI was also in overbought territory. Thus far today, the DXY is down nearly 1% and back in the long-term upward sloping channel.
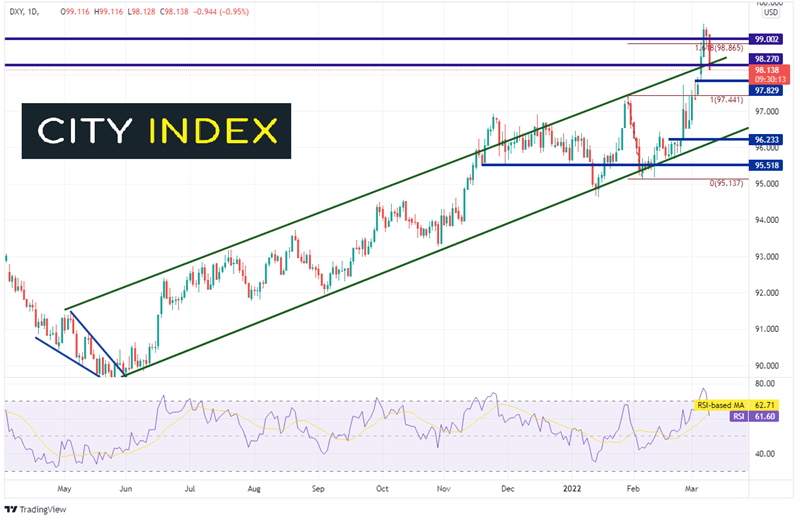
Source: Tradingview, Stone X
Trade DXY now: Login or Open a new account!
• Open an account in the UK
• Open an account in Australia
• Open an account in Singapore
Why the reason for optimism? Yesterday, Ukraine’s Zelensky said that he would no longer be insistent that Ukraine would apply for NATO membership. In addition, humanitarian corridors have finally been opened to allow aid to enter hard-hit cities and to allow citizens to leave. Today, Zelensky also said that he is ready for diplomatic solution and ready to discuss neutrality, as long as there are security guarantees.
One of the main beneficiaries of a weaker US Dollar is GBP/USD. The pair has been trading lower since reaching a high on May 31st, 2021, near 1.4250. After forming a wedge during November 2021, the pair made a near-term low of 1.3160 on December 9th, 2021 and bounced to test a downward sloping trendline that dates to July 29th, 2021. After failing to close above the trendline, GBP/USD resumed lower and on Monday, took out the December 9th, 2021 lows. Notice however, that the RSI was oversold, indicating the possibility for a pause or reversal.
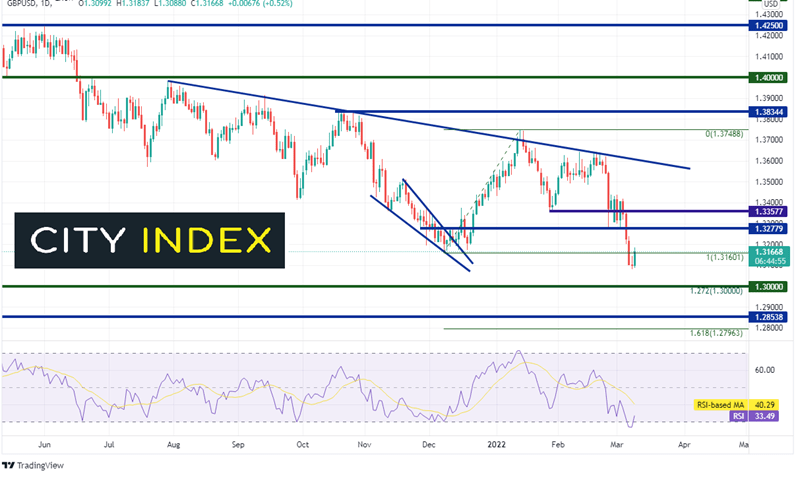
Source: Tradingview, Stone X
Trade GBP/USD now: Login or Open a new account!
• Open an account in the UK
• Open an account in Australia
• Open an account in Singapore
First resistance on the 240-minute timeframe is at the February 24th and March 2nd lows near 1.3271. Above there, resistance is at the 38.2% Fibonacci retracement level from the highs of February 18th to the low of March 8th near 1.3296, then horizontal resistance and the 50% retracement level from the same timeframe at 1.3362. First support is at the March 8th low of 1.3082. Below there, GBP/USD can drop to the psychological round number support level of 1.3000, which is also the 127.2% Fibonacci extension from the lows of December 9th, 2021 to the highs of January 13th. Third support is the November 2, 2020 low of 1.2854. (see daily)
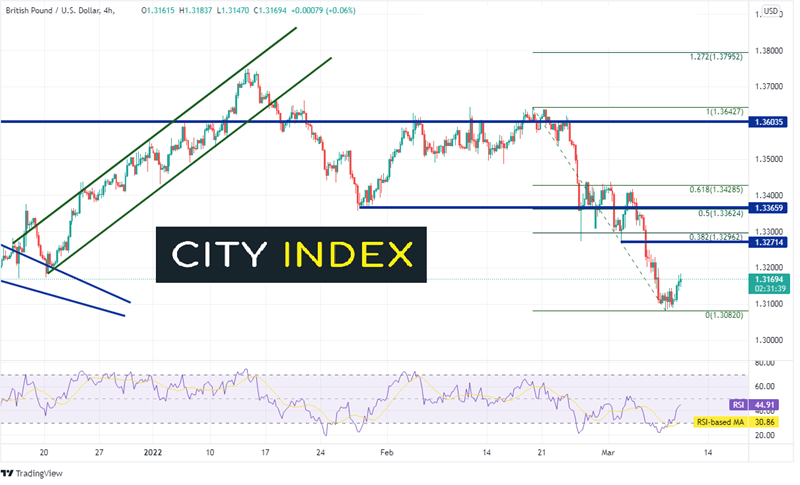
Source: Tradingview, Stone X
With hope and optimism that a ceasefire agreement between Russia and Ukraine can be reached, the DXY has moved lower and GBP/USD has gone bid. However, any negative headlines could cause the 2 assets to reverse. Note that both the FOMC and the BOE meet next week. The focus next week for GBP/USD may shift off the Russia/Ukraine conflict and onto the central bank meeting results.
Learn more about forex trading opportunities.
Latest market news
Yesterday 01:32 PM
Yesterday 09:35 AM
Yesterday 07:23 AM
Yesterday 04:48 AM
Yesterday 12:17 AM
July 25, 2024 10:39 PM
Latest Trade Ideas articles

Yesterday 09:35 AM

Yesterday 12:17 AM

July 25, 2024 10:39 PM

July 25, 2024 05:30 PM