


S&P 500 Key Points
- The S&P 500 is poised to close higher for the 7th straight week, a streak that has only occurred 40 times in the index’s 100-year history.
- Historical returns for the S&P 500 have been generally strong following previous 7-week winning streaks.
- S&P 500 bulls will remain in control as long as the index holds above previous-resistance-turned-support at 4600, with potential for a move up to the record highs near 4820.
Historical Analysis of 7-Week S&P 500 Winning Streaks
After a huge rally through the middle of the week, it’s a foregone conclusion that the S&P 500 will finish higher for the 7th consecutive week, a relatively rare streak historically. Any time I see an unusual price action, I like to put it into historical context and analyze what it could mean about the future.
Going back to the inception of the S&P 500 in 1923, there have been just 40 7+ week winning streaks, or approximately 1 every 2.5 years. As the chart below shows, they’ve usually occurred in the middle of bull markets, with only rare appearances near significant tops and bottoms:
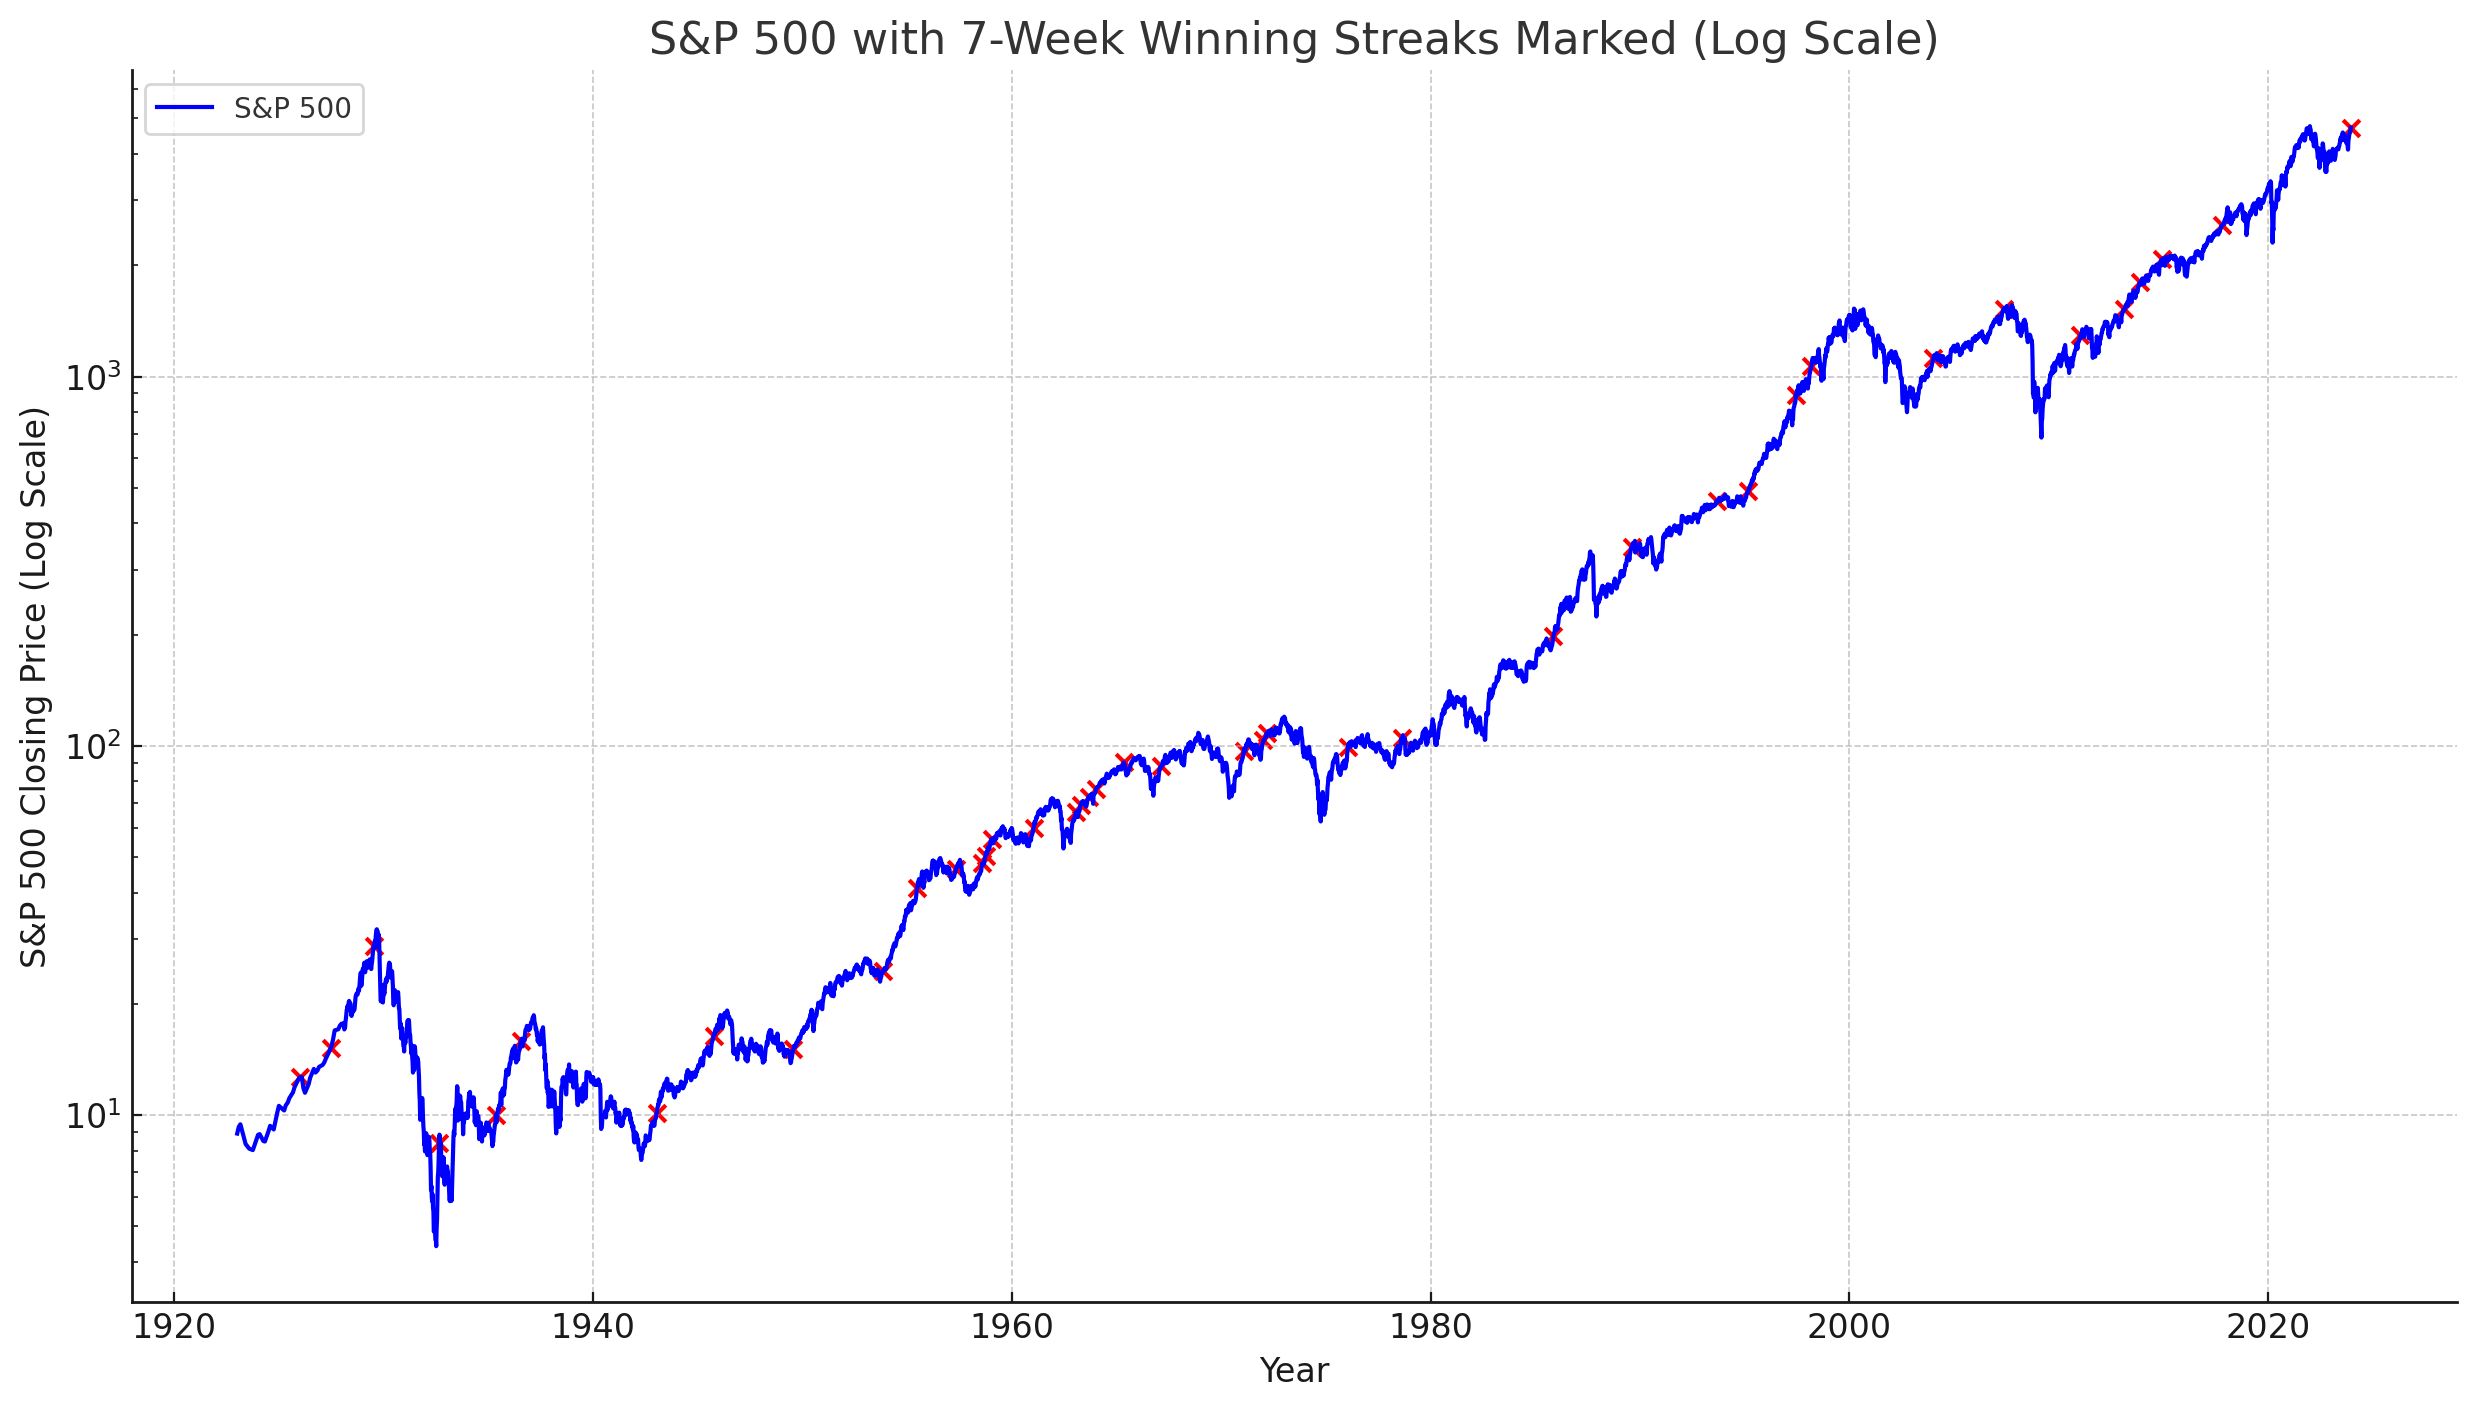
Source: Tradingview, StoneX
The next obvious question surrounds how long the current winning streak may last. At least looking at the historical record, the odds suggest that the streak is likely to come to an end sooner rather than later. Roughly 80% of past 7-week winning streaks have failed to extend to 10 weeks, with only a handful stretching beyond that:
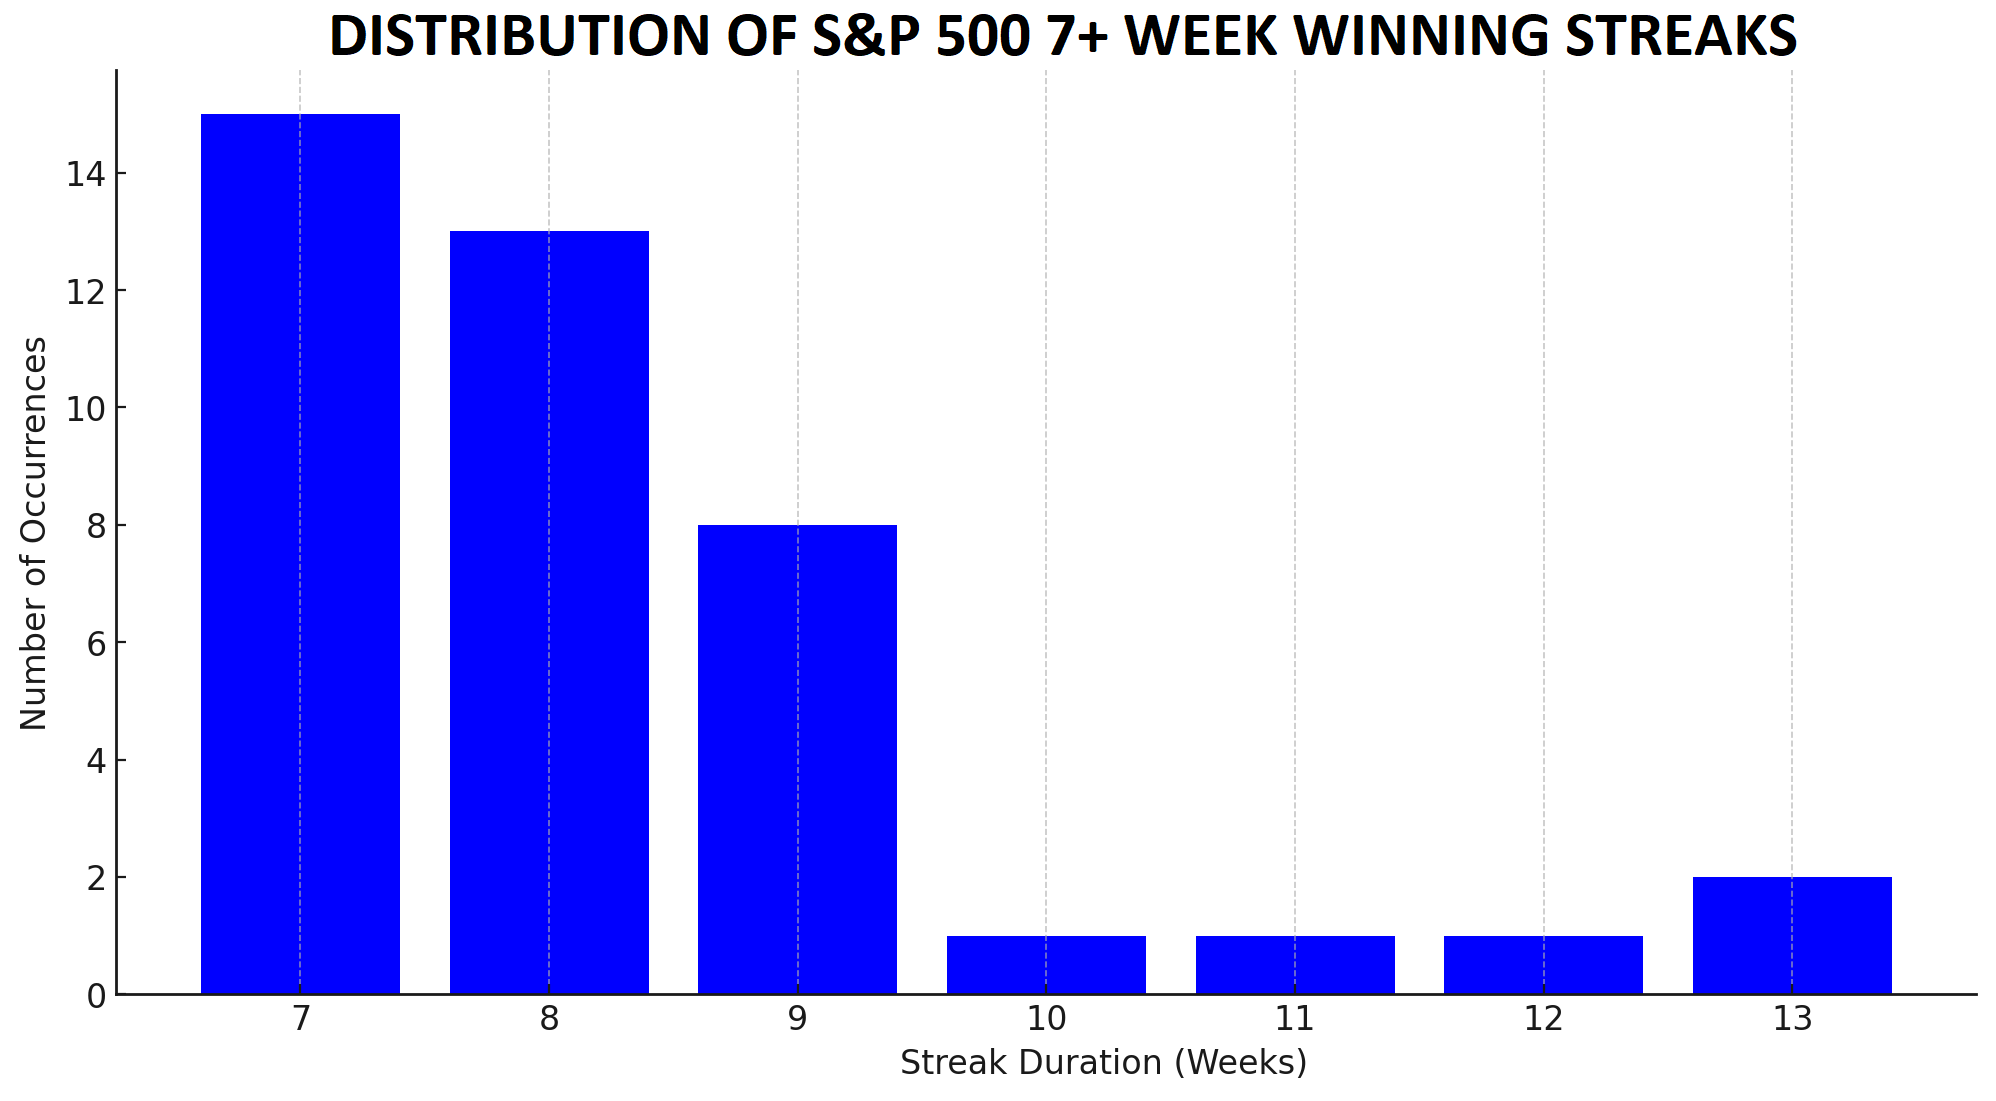
Source: Tradingview, StoneX
For those who are interested, the longest S&P 500 winning streak was 14 weeks, set back in both 1927 and 1957.
Perhaps of most interest to readers, historical returns for the S&P 500 have been generally strong following previous 7-week winning streaks, with the index showing the following average returns over the next 4, 13, and 52 weeks:
- 4 weeks later: +1.5% (vs. 0.6% in all 4-week periods)
- 13 weeks later: +4.1% (vs. 2.1% in all 13-week periods)
- 52 weeks later: +13% (vs. 8.4% in all 52-week periods)
The S&P 500 has also seen positive moves at a higher-than-historical-average rate over the next month, quarter and year:
- 4 weeks later: Higher 73% of the time (vs. 60% in all 4-week periods)
- 13 weeks later: Higher 83% of the time (vs. 64% in all 13-week periods)
- 52 weeks later: Higher 83% of the time (vs. 69% in all 52-week periods)
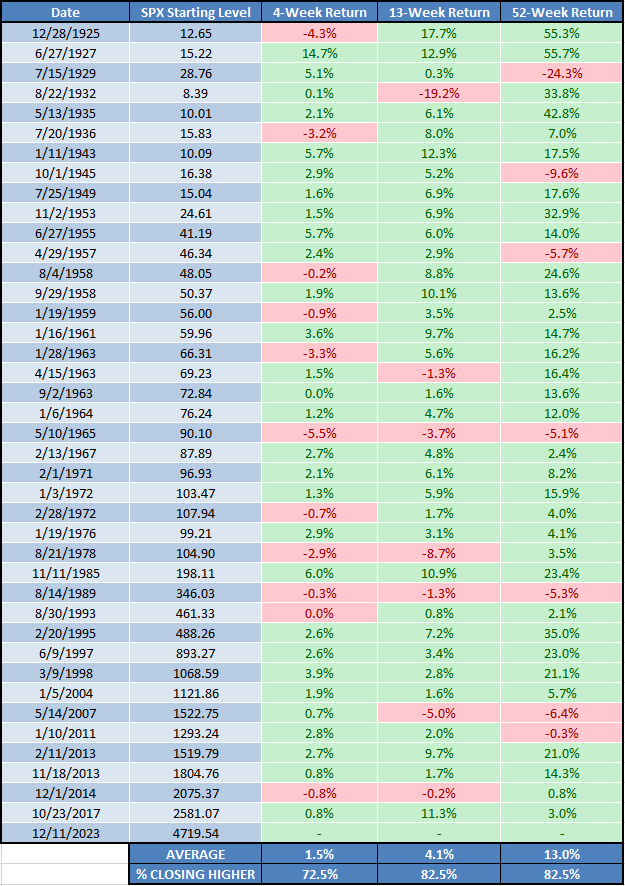
Source: Tradingview, StoneX
Time will tell how this current winning streak plays out, but historical 7+ week winning streaks in the index have been a generally bullish development for returns over the next month, quarter, and year.
S&P 500 Technical Analysis – SPX Daily Chart
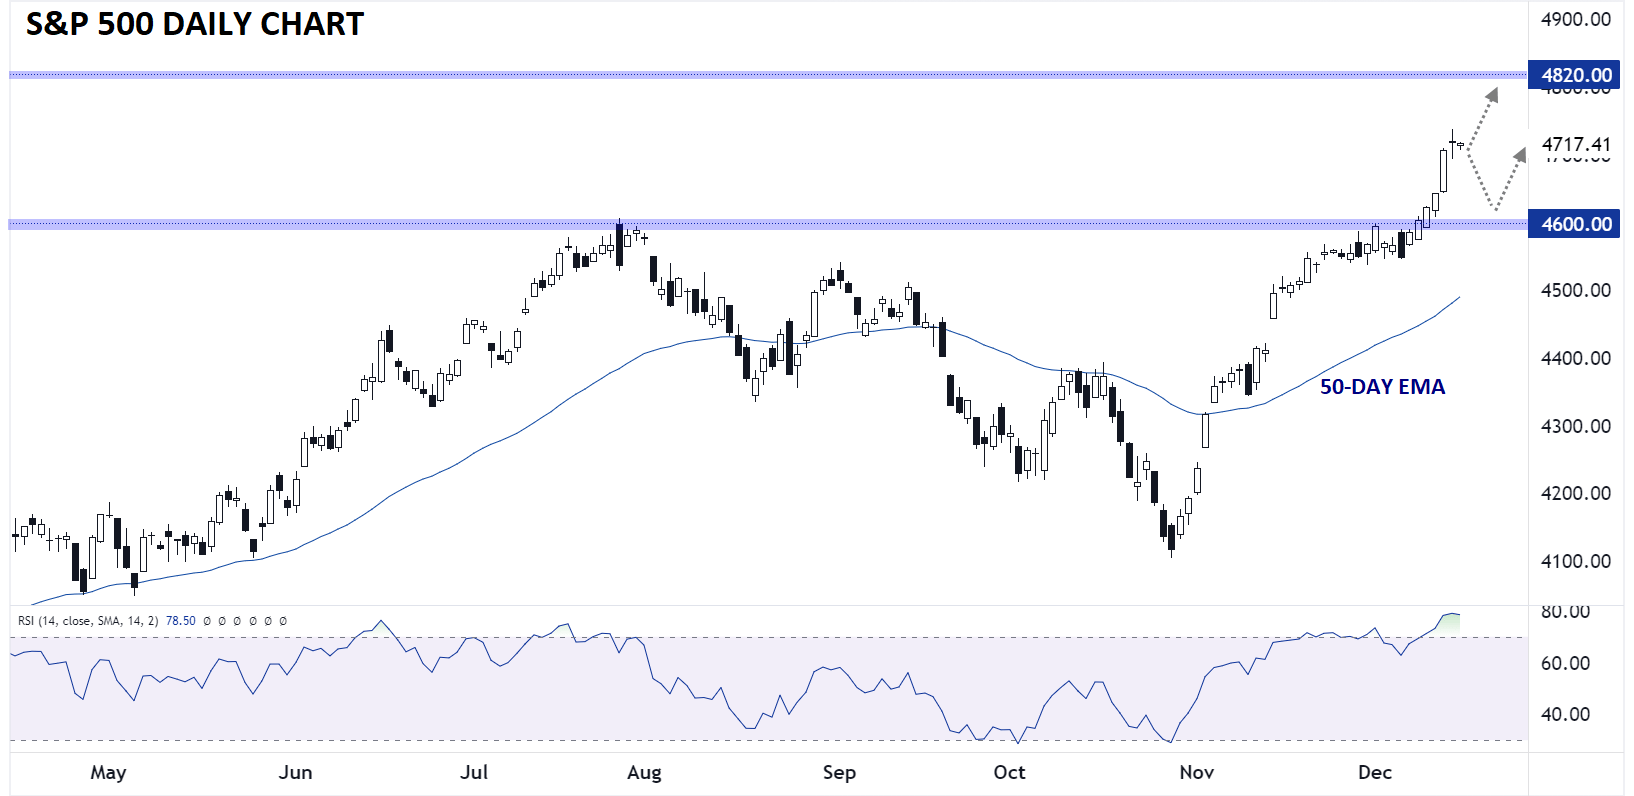
Source: TradingView, StoneX
Looking at the S&P 500 chart, the index is consolidating this week’s impressive gains just above the 4700 area. While the trend is clearly higher across multiple timeframes, it is notable that the S&P 500 is well into overbought territory on its 14-day RSI, signaling the potential for a pullback or consolidation as we head into the lower-liquidity holiday period.
In the short term, S&P 500 bulls will remain in control as long as the index holds above previous-resistance-turned-support at 4600, with potential for a move up to the record highs near 4820. Only a break below 4600 would call the near-term bullish bias into question.
-- Written by Matt Weller, Global Head of Research
Follow Matt on Twitter: @MWellerFX
Latest market news
Today 12:16 PM
Today 08:17 AM
Latest US SP 500 articles

April 14, 2024 04:00 AM

March 30, 2024 06:00 PM

March 26, 2024 06:08 PM
February 27, 2024 01:52 PM