


Key takeaways
- The RBNZ increased rates by 25bp to 5.5%, below some estimates of a 50bp hike
- Forecasts retained a terminal rate at 5.5%
- The statement was relatively dovish, compared to prior statements
- The government’s budget is not deemed to be as inflationary as feared
- Initial confusion over a pause stemmed from incorrect reporting by some data vendors (and slow RBNZ website)
- NZD pears broadly lower by ~1%
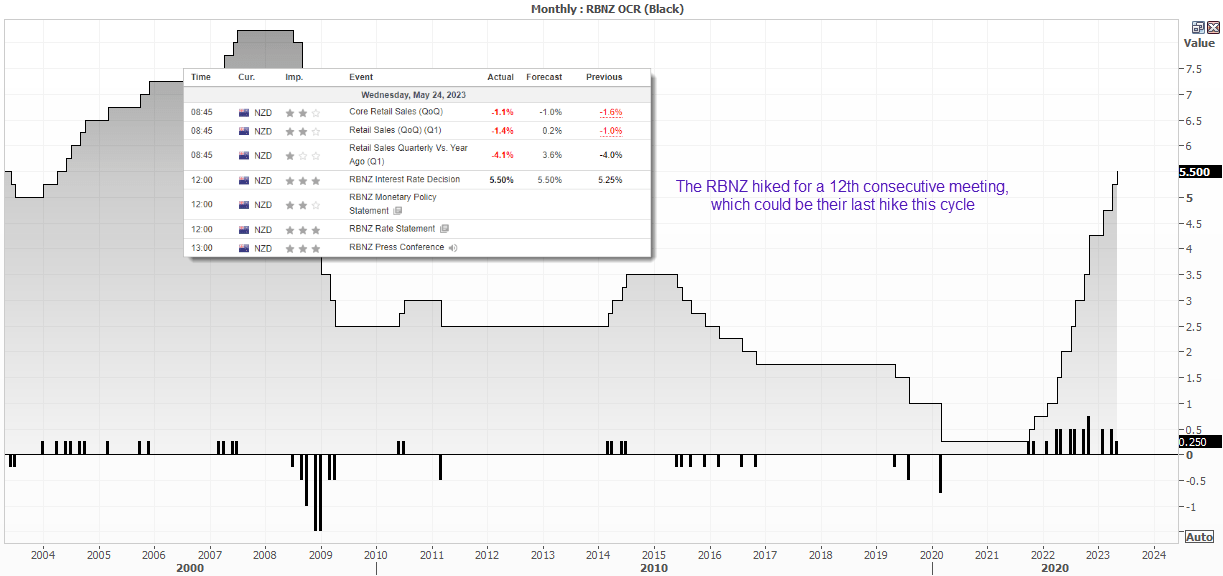
Depending on who is asked, the RBNZ hiked rates by 25bp as expected (or not by the 50bp as expected some others). A dovish statement with an unadjusted peak rate at 5.5% means the RBNZ have signalled the end of their tightening cycle, although warned that rates will need to remain ‘restrictive’ (high) for soe time.
NZD pairs were around -1% lower, AUD/NZD rose 0.9% and we’re not seeing any immediate appetite to support the Kiwi dollar at the time of writing, although neither are prices dropping further.
But the release was not plain sailing, as Reuters and presumably any other data vendor which copies them, initially printed a hold at 5.25% before correcting to 5.5%. The RBNZ website was slow also slow to update to the latest report (at least it was on my end). By quite how much of an impact on the Kiwi’s selloff sue to the incorrect figure is hard to decipher, but we can see that the New Zealand dollar was heavily sold off across the board and it has not really recovered since.
A relatively dovish RBNZ statement
In relative terms, the statement was the most dovish the RBNZ have released in quite some time and certainly this tightening cycle. And by that we mean it was not as hawkish as expected. The majority of the statement is tipping its hat to slower demand overall and, whilst migration and tourism is a support demand to a degree, it seems the RBNZ are not overly concerned with the government’s budget which was deemed by many as highly inflationary. Weaker than expected retail sales data released ahead of the announcement may have also helped with their outlook.
Summary of the RBNZ statement and MPS
- The level of interest rates are constraining spending and inflation pressure
- The OCR will need to remain at a restrictive level for the foreseeable future
- Global growth remains weak and inflation pressures are easing
- New Zealand’s inflation is expected to continue to decline from its peak and with it measures of inflation expectations
- Consumer spending growth has eased and residential construction activity has declined
- Businesses are reporting slower demand for their goods and services
- Businesses report that a lack of demand, rather than labour shortages, is now the main constraint on activity
- Net inward migration and tourism spending is supporting demand
- Broader government spending is anticipated to decline in inflation-adjusted terms and in proportion to GDP
NZD/USD daily chart
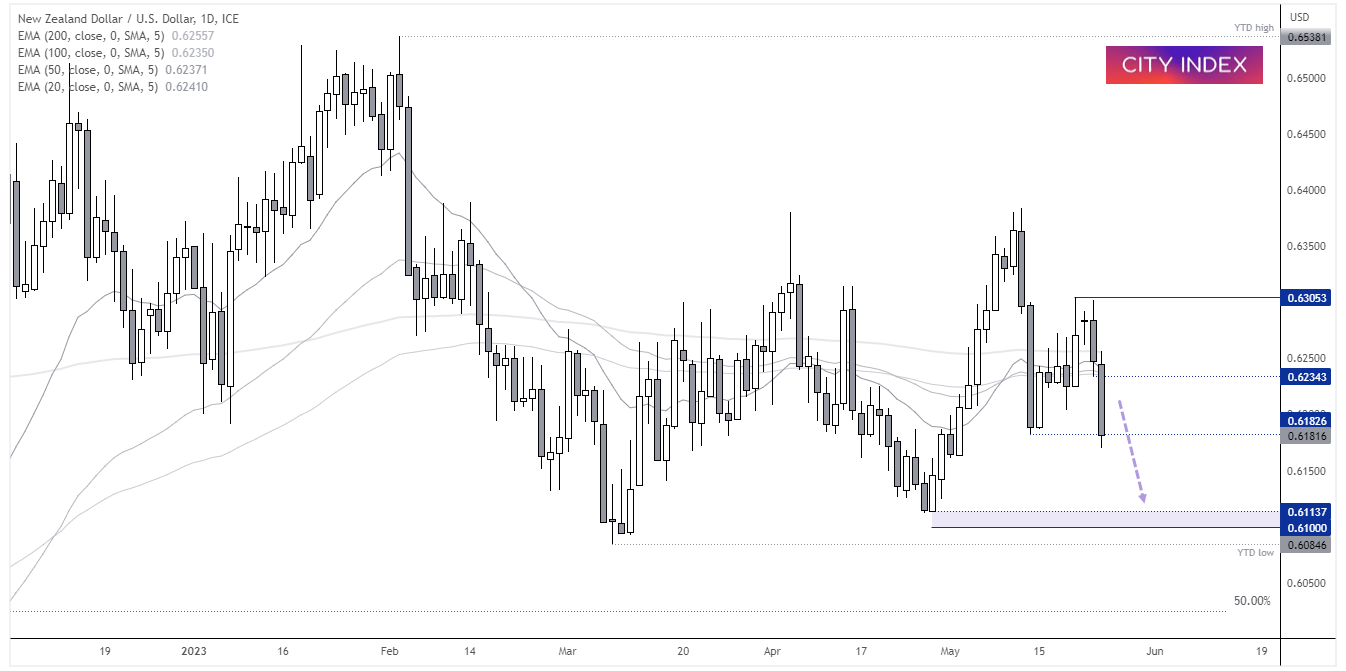
After failing to hold above 63c in recent sessions, momentum has turned sharply lower and seen a clean break beneath the 20, 50, 100 and 200-day EMAs. NZD/USD is on track for its worst day in seven, although prices are showing signs of stability around the 0.6182 low ahead of the European open. This risks a minor rebound from current levels but, with trades across Europe and the US yet to react, the potential for a second round of selling remains. Ultimately, any pullback towards the 0.6235 lows could be seen as a gift to bearish swing traders, assuming any such pullback makes it that far. But with the RBNZ signalling the end of their tightening cycle, we suspect a move down to 61c is feasible, especially if the US dollar weakens.
NZD/USD 4-hout chart
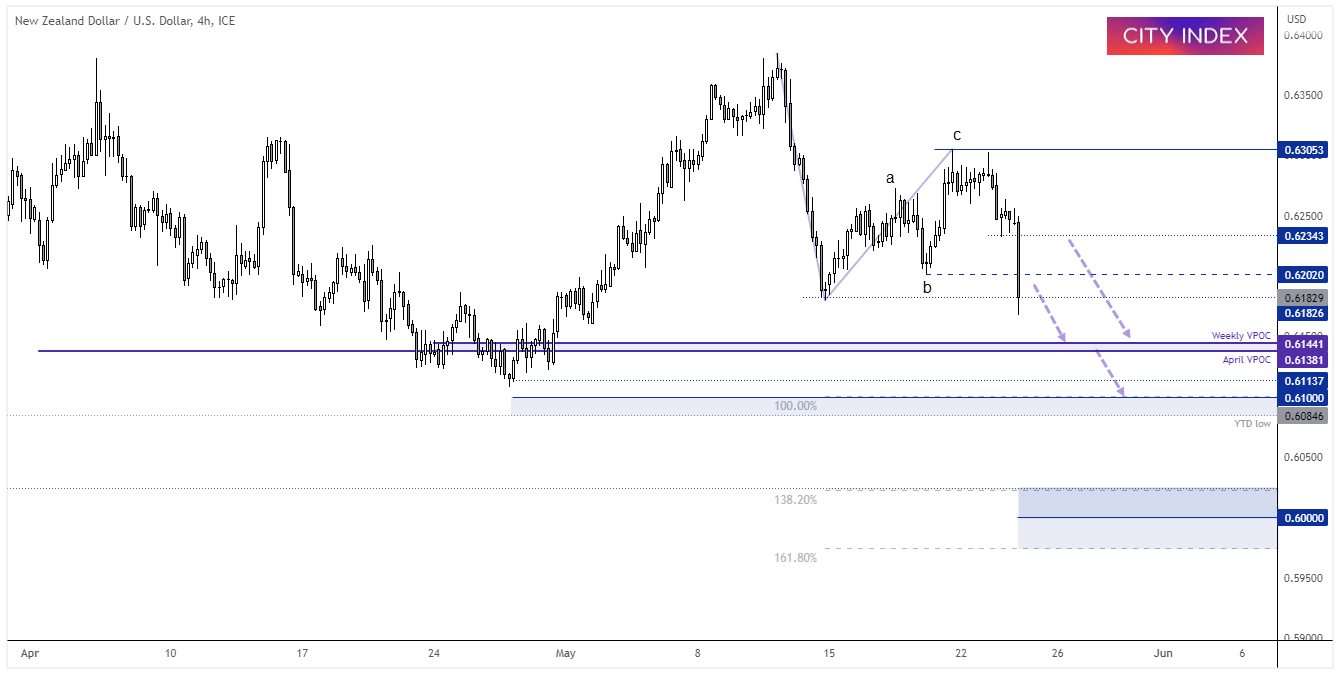
As it appears as though an ABC correction has completed, the turn lower in momentum should mean we’re now in a wave III of an impulsive move lower. If so, a conservative 161.8% projection sits at 0.5975. However, there are several levels along the way, such as the YTD lows around the YTD low and 100% projection, and of course the 60c level which could provide strong support. Initially at least.
-- Written by Matt Simpson
Follow Matt on Twitter @cLeverEdge
How to trade with City Index
You can trade with City Index by following these four easy steps:
-
Open an account, or log in if you’re already a customer
• Open an account in the UK
• Open an account in Australia
• Open an account in Singapore
- Search for the market you want to trade in our award-winning platform
- Choose your position and size, and your stop and limit levels
- Place the trade
Latest market news
Yesterday 01:32 PM
Yesterday 09:35 AM
Yesterday 07:23 AM
Yesterday 04:48 AM
Yesterday 12:17 AM
July 25, 2024 10:39 PM
Latest Trade Ideas articles

Yesterday 09:35 AM

Yesterday 12:17 AM

July 25, 2024 10:39 PM

July 25, 2024 05:30 PM