


- Japan’s GDP rose 1.6% y/y in Q1, beating estimates of 0.7% and up from -0.1% prior
- Quarterly GDP was also a beat at 0.4% q/q (0.1% forecast, 0.1% prior)
- The GDP deflator (price of goods within GDP) rose to a near 8year high
- The Nikkei rose to 30k after the release
- Foreign investment in Japan’s stock market has increased in recent weeks to support the rally
- Net-long exposure to Nikkei futures are also increasingly bullish, without being at a sentiment extreme
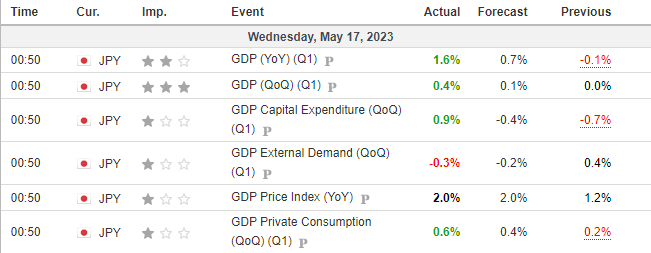
Whilst Japan’s 1.6% y/y growth will not set global growth figures alight, it did come in more than twice economists’ forecasts of 0.7% and could potentially help raise it above the BOJ’s fiscal 2023 forecast. Growth also expanded for the first quarter in three, capital expenditure expanded unexpectedly and private consumption also bear estimates.
However, it is worth noting that the GDP deflator – which measures the prices of goods within GDP – rose to its highest level since late 2015 of 2% y/y. Whist the BOJ will take note of this development, they’re unlikely to take any action any time soon, as demonstrated in the lacklustre response of the yen. BOJ governor Ueda recently said the central bank could remove YCC (yields curve control) and shrink its balance sheet, but only if their price target is reached in a ‘sustainable, stable manner’ (there’s no urgency). Still, tomorrow’s trade data will be in focus to see if exports can maintain GDP’s momentum in Q2 and Friday’s inflation data will be closely watched (Tokyo’s CPI suggests could also come in higher).
Foreign investors and large speculators pike into the Nikkei:
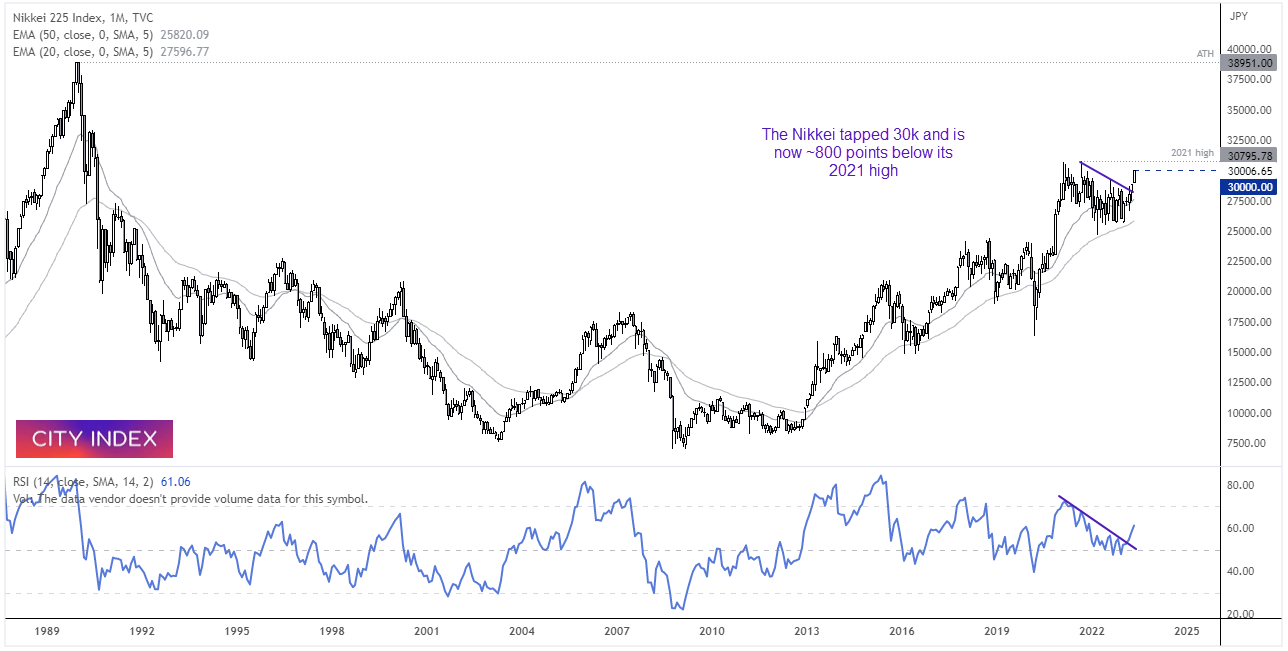
Whilst the yen lacked a response, the local share market had an answer. Japan’s Nikkei 25 embraced the positive data set and rose to a 20-month high of 20k. It has a fair way to go to retest its all-time high just shy of 40k, but a retest of the 2921 high seems achievable given the strength of the trend on the monthly chart and that it is now just ~800 beneath it.
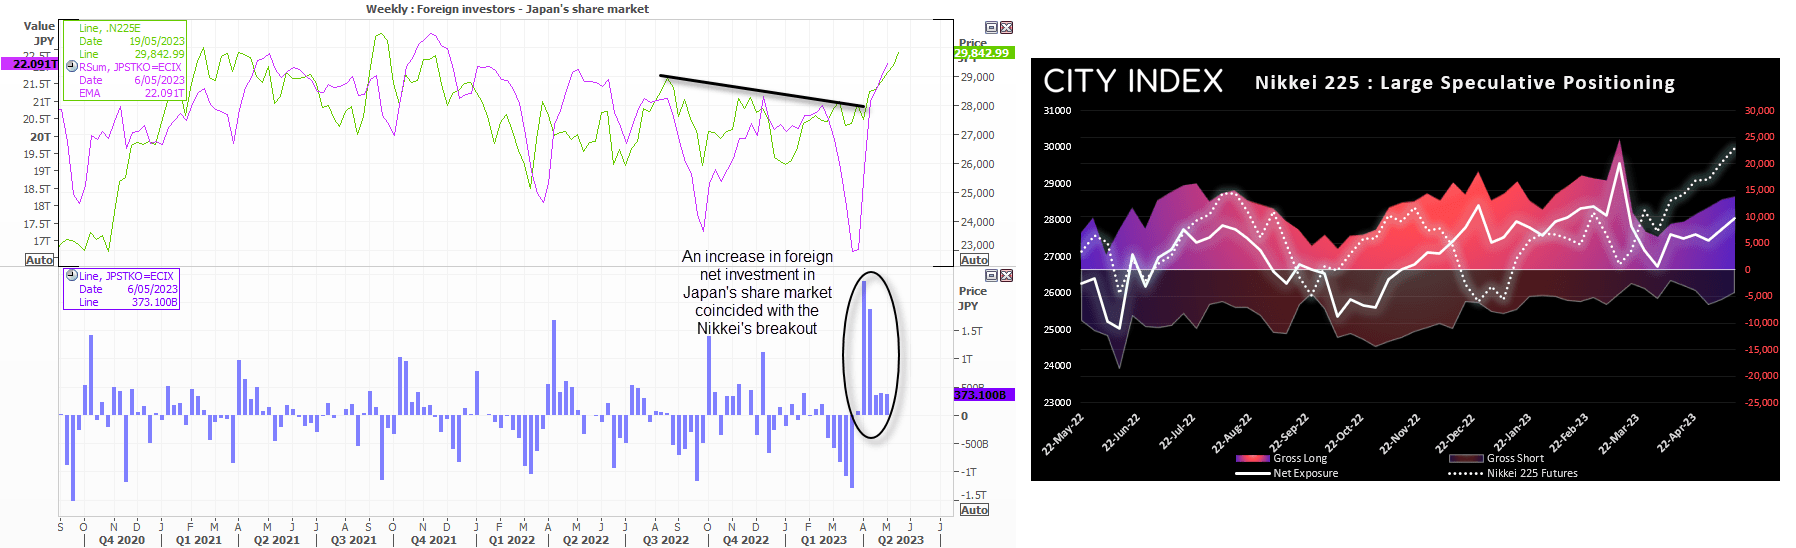
Furthermore, we note that foreign investment in Japan’s share market has increased over the past six weeks, which coincides with the breakout from consolidation of the Nikkei. Net-long exposure to Nikkei futures (in yen terms) also increasing, with rising gross longs and diminishing gross shorts without an immediate threat of a sentiment extreme. Given the strength of the trend on the monthly chart overall, a break above 30,800 appears to be more likely than not.
Nikkei 1-hour chart:
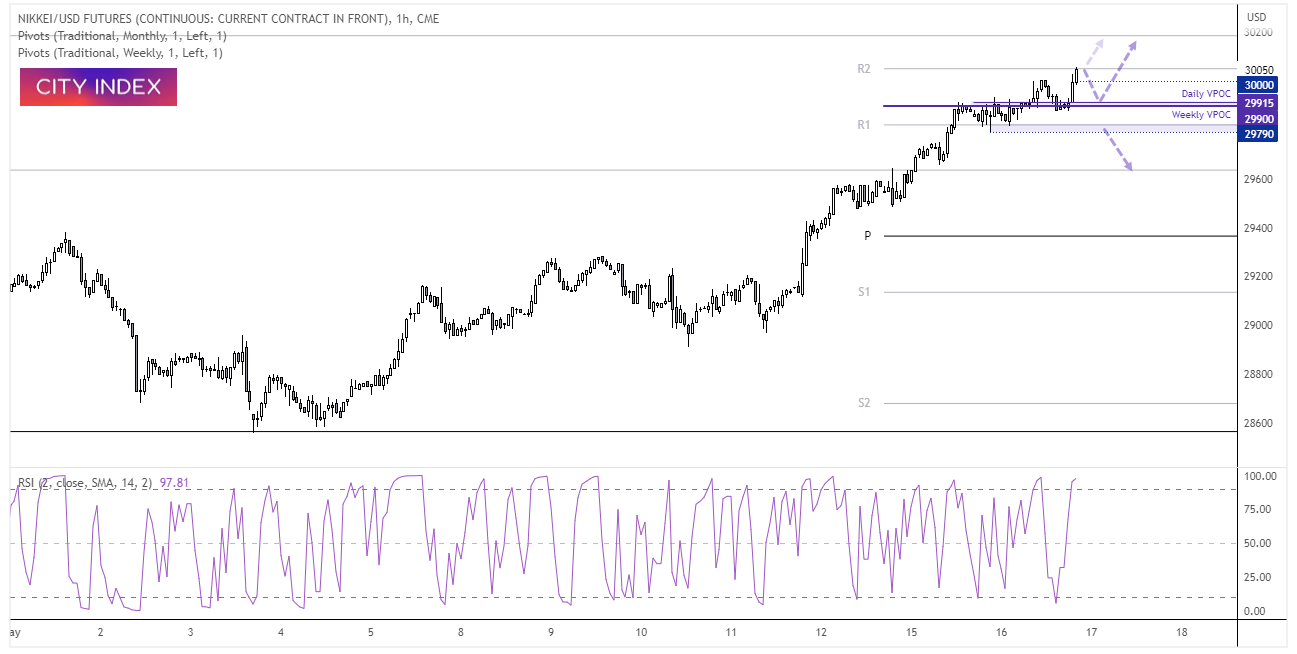
Whilst the Nikkei has broken above 30k at the time of writing, such milestone levels rarely break upon their first attempt. And that makes us a little hesitant to chase this one higher over the near term. Furthermore, RSI (2) is overbought, the daily (RSI) 14 is also overbought, and prices are meandering around the weekly R2 pivot point.
Hopefully we can get a pullback from current levels and hold above the 29,900 – 29,915 area which has seen heavy trading activity (and presumably bullish). The next upside target is the monthly R2 near 30,200, whilst a break beneath the 29,790 assumes a correction has begun.
-- Written by Matt Simpson
Follow Matt on Twitter @cLeverEdge
How to trade with City Index
You can trade with City Index by following these four easy steps:
-
Open an account, or log in if you’re already a customer
• Open an account in the UK
• Open an account in Australia
• Open an account in Singapore
- Search for the market you want to trade in our award-winning platform
- Choose your position and size, and your stop and limit levels
- Place the trade
Latest market news
Yesterday 01:32 PM
Yesterday 09:35 AM
Yesterday 07:23 AM
Yesterday 04:48 AM
Yesterday 12:17 AM
July 25, 2024 10:39 PM
Latest Trade Ideas articles

Yesterday 09:35 AM

Yesterday 12:17 AM

July 25, 2024 10:39 PM

July 25, 2024 05:30 PM