


February 28, 2023 7:18 AM

New Zealand released its Q4 2022 Retail Sales data early on Monday. The actual print was -0.6% vs an expectation of +1.7% and a Q3 print of +0.6%. A large part of the drop was goods produced in manufacturing and electronics. However, there was a large pickup in the services sector, with food and beverages up double digits! This was largely due to the reopening of international travel, in which New Zealand saw strong demand for accommodations (+28%). But remember, this print is for Q4 2022, which was a long time ago. Have things changed since then? Recall that Cyclone Gabrielle recently came through the region causing heavy damage and flooding to some areas. Will these areas see a pickup in spending as they rebuild? This may pump up retail sales in Q1 2023.
The RBNZ doesn’t meet again until April 4th. However, recall from the February 22nd meeting that the central bank hiked by 50bps to raise the OCR to 4.75%. The Committee saw additional increases in rates in the months ahead. Can the RBNZ keep economic growth down as parts of New Zealand rebuild after the cyclone?
On a daily timeframe, NZD/USD has been trading within a range since November 30th, 2022. Some may look at this as a double or triple top. Regardless, the target is the same: the height of the pattern added to the breakdown point. In this case, the target is near 0.5865. NZD/USD traded between 0.6360 and 0.6538 from November 30th, 2022, until February 24th. The pair not only broke below the bottom of the range, but also broke the 200 Day Moving Average near 0.6180. On Monday, NZD/USD also broke below the 38.2% Fibonacci retracement from the lows of October 13th, 2022, to the highs of February 2nd at 0.6146.
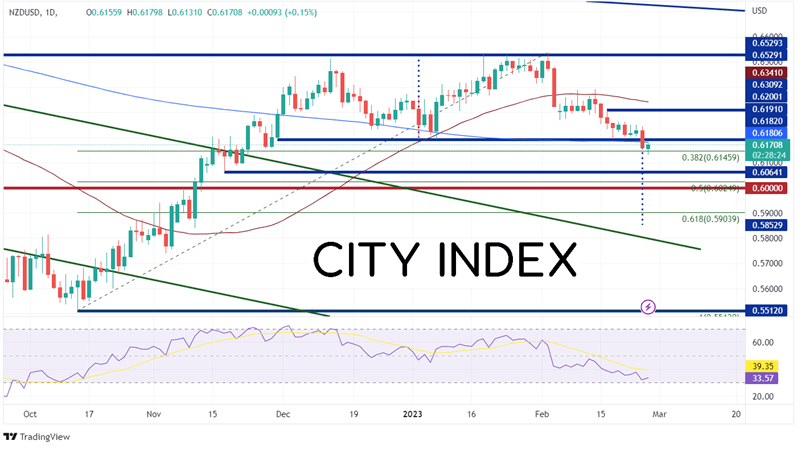
Source: Tradingview, Stone X
Trade NZD/USD now: Login or Open a new account!
• Open an account in the UK
• Open an account in Australia
• Open an account in Singapore
The first support level is at the lows from November 17th, 2022, at 0.6061. Below there, price can move to the 50% retracement level from the above-mentioned timeframe at 0.6022, then the psychological round number support level of 0.6000. However, if this proves to be a false breakdown and NZD/USD moves back into the range, the first resistance is at Friday’s high of 0.6244. Above there, price can move to horizontal resistance at 0.6304, then the 50 Day Moving Average at 0.6341.
One has to question whether the weak Q4 data will hurt the Kiwi going forward. With rebuilding, more spending, and higher inflation expected, some may think it won’t. However, the next RBNZ meeting isn’t until April 4th. The Committee will have plenty more data to look at before it decides what to do with interest rates!
Learn more about forex trading opportunities.
Latest market news
Yesterday 01:32 PM
Yesterday 09:35 AM
Yesterday 07:23 AM
Yesterday 04:48 AM
Yesterday 12:17 AM
July 25, 2024 10:39 PM
Latest Trade Ideas articles

Yesterday 09:35 AM

Yesterday 12:17 AM

July 25, 2024 10:39 PM

July 25, 2024 05:30 PM