


Unexpected strength in US economy means it’s too early for the Federal Reserve to declare victory over inflation, meaning it can’t afford to signal an end to interest rate hikes right now. At the same time, given the resilience shown to tightening already delivered, it’s difficult to argue there’s a need to cut interest rates in the foreseeable future. Combined, it suggests it will be difficult for the FOMC to retain an identical Fed funds rate profile in September to that issued three months ago without foregoing some inflation-fighting credibility, pointing to a meaningful risk its updated profile will show fewer rate cuts next year.
Higher, flatter Fed funds profile could push USD and yields higher
If you’re looking for a scenario that could spark a wave of US dollar strength and rupture the US yield curve higher, look no further than a higher and flatter rate profile. In a week full of risk events, signaling another delay to the start of the next easing cycle is the most obvious known to generate a sizable volatility event.
Looking at the FOMC’s Summary of Economic Projections (SEP) issued in June, it’s not hard to see why the data could force a rethink about whether a full percentage point of rates cuts is realistic next year, as the former profile showed.
For one, the economy appears to be strengthening, meaning the Fed’s 2023 1% GDP forecast will be revised higher meaningfully yet again. If taken at face value, it hints the economy may be operating above its estimated neutral pace, generating upside risks for inflation and downside risks for unemployment the longer it continues.
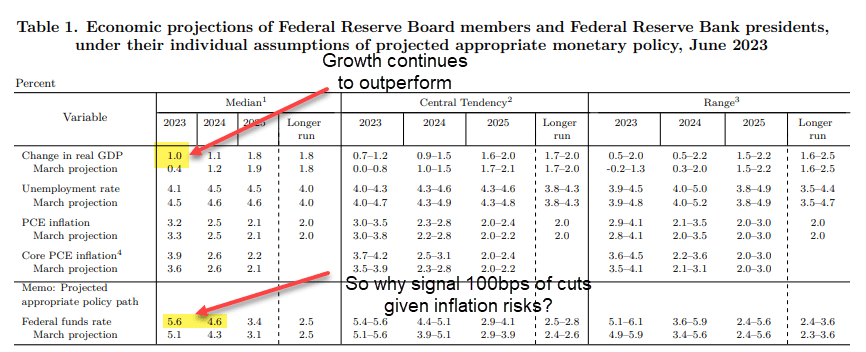
Source: Federal Reserve
Granted, progress has been made towards both the Fed’s core PCE and unemployment forecasts since June, but will that remain the case if economic activity remains resilient? For policymakers who have made it clear they’ll persist until confident inflation has been defeated, it would be counterintuitive to continue flagging four 25-point rate cuts next year. The data may force them to scale back expected easing.
Uncertainty elevated on what the Fed may signal next year
While a risk, not everyone expects the Fed will change its near-term Fed funds projection, underlining why such a move could push US bond yields and dollar higher.
Goldman Sachs is not on board, forecasting the Fed will lift it’s longer-term neutral Fed funds rate (the level where policy is neither expansionary nor contractionary for economic activity) marginally higher but leave the 2023, 2024 and 2025 projections unchanged.
“We expect the 2024 and 2025 medians to remain unchanged at 4.625% and 3.375%, and we expect the new 2026 dot to show 2.875%,” Goldman said in a recent note. “Most participants will likely anticipate cutting at a roughly quarterly pace, though some might expect fewer than four cuts in 2024 if they do not expect to be cutting by Q1, and some will likely continue to project a slightly faster pace of normalization further down the road when they expect the inflation problem to be more definitively solved.”
Given how much Jerome Powell and other FOMC members have stressed the importance of not signalling easier policy before the inflation threat has been extinguished, allowing a message that suggests just that could end up deliver the exact outcome they fear: a second wave of inflationary pressures. That’s why I’m unconvinced.
Nasdaq vulnerable to higher yields and US dollar
Should the Fed signal the risk of another hike this year and fewer cuts next, it would likely push bond yields and the US dollar higher, generating a risk-off environment for broader markets. As an index with firms who generate a significant amount of earnings overseas, and whose valuations are susceptible to rising risk-free rates, the Nasdaq 100 stands out as one market that looks particularly vulnerable, especially after the rebound this year.
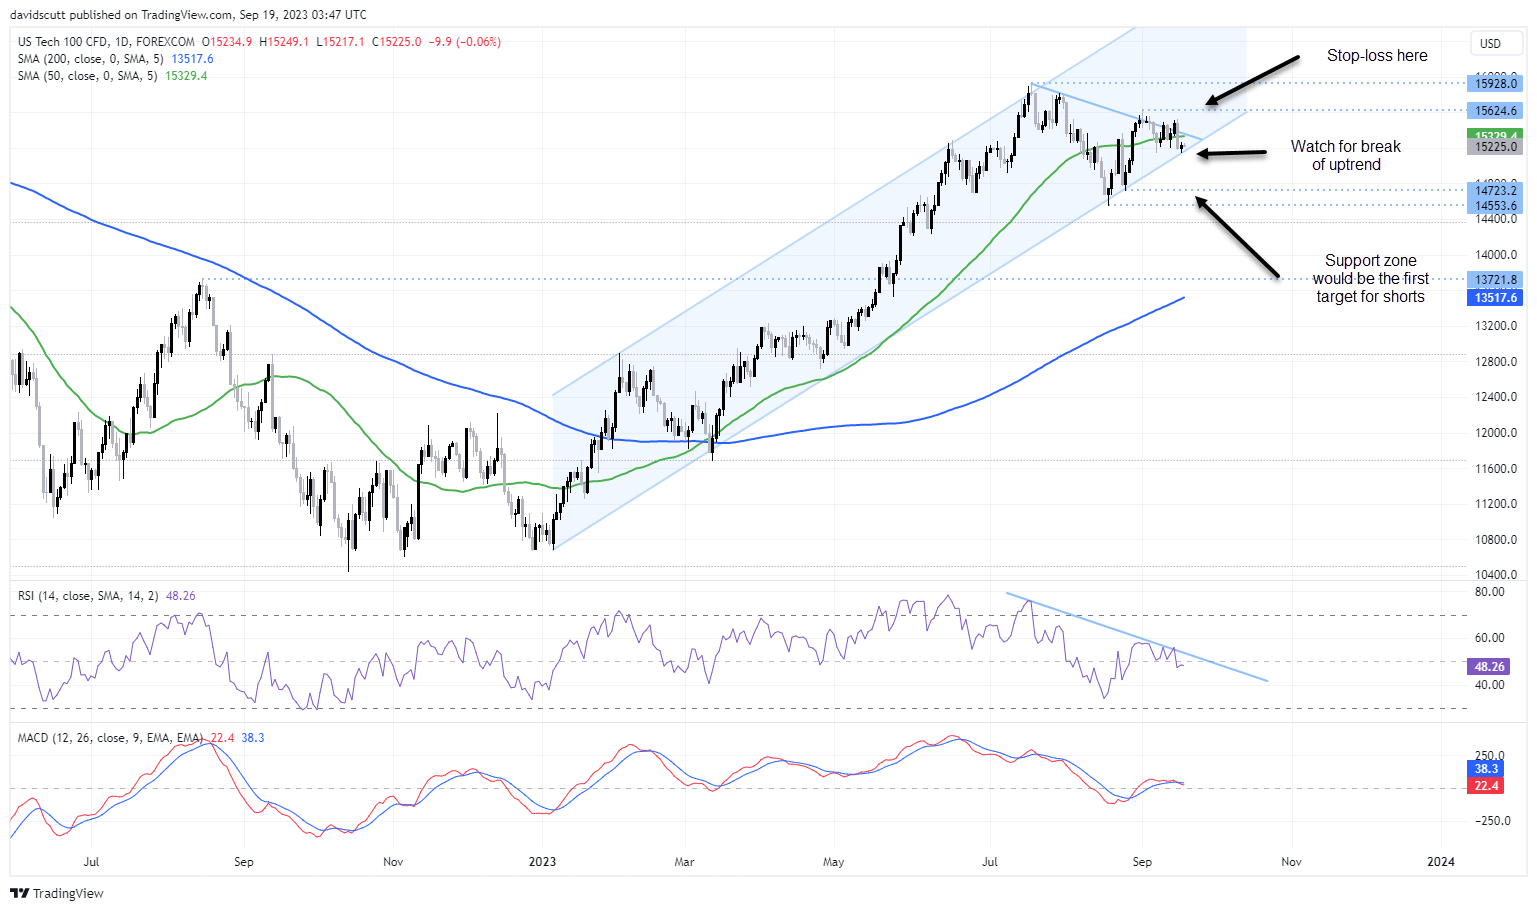
Sitting right on uptrend support on the daily, and with a MACD crossover signalling potential downside, a risk-off environment could easily spark a trend change in what is seasonally a difficult period of the year. On the downside, the index bounced strongly from a support zone starting around 14,720, making that the first logical test for shorts. If that were to give way, there’s little major support evident until we get down towards 13,720, the peak struck in August last year.
As for upside protection, the index has struggled to meaningful break above 15,500 recently, suggesting a stop-loss above the September 1 high of 15,625 may be suitable.
-- Written by David Scutt
Follow David on Twitter @scutty
How to trade with City Index
You can trade with City Index by following these four easy steps:
-
Open an account, or log in if you’re already a customer
• Open an account in the UK
• Open an account in Australia
• Open an account in Singapore
- Search for the market you want to trade in our award-winning platform
- Choose your position and size, and your stop and limit levels
- Place the trade
Latest market news
Yesterday 06:37 AM
April 26, 2024 01:25 PM
Latest US Tech 100 articles


April 25, 2024 03:09 PM

April 16, 2024 08:00 PM

April 16, 2024 04:54 PM