


November 1, 2022 6:53 AM

Is it do-or-die time for the NASDAQ 100?
According to Nick Timiraos of the Wall Street Journal, who is said the be a Fed mouthpiece, a decision to change the interest rate hike from 75bps at this week’s meeting seems unlikely. A 75bps rate hike will put the Fed Funds rate at 4.0%. In addition, he said that the Fed may discuss cutting back the pace of rate increases to 50bps at the December meeting. This case would be a positive for stocks in general, as it would mean the end of the hiking cycle is in sight.
Everything you wanted to know about the Federal Reserve
At the same time, some of the biggest names in the NASDAQ 100 have missed earnings and/or guided lower. GOOG posted an EPS of 1.06 vs and expected EPS of 1.25. It also reported lower than expected revenues. META posted a gain of 1.64 vs an expectation of 1.88. In addition, the Facebook parent also said that it faces near-term challenges on revenue. It also sees its reality labs operating losses in 2023 significantly higher than previously anticipated. And although AMZN beat expectations on its Earnings per Share, it guided its Q4 sales lower to $140B-$148B vs an estimate of $155B. This doesn’t bode well for the NASDAQ 100 if the trend continues.Meanwhile, on a daily timeframe of the NASDAQ 100, the large tech index made an all-time high on November 21st, at 16764.86. The index traded lower in a descending wedge formation making a low of 11311.05 on June 16th. The NASDAQ 100 then broke out of the wedge and retraced to the 61.8% Fibonacci level from the highs of March 29th (top of wedge) to the lows of June 16th, at 13720.91. The index then moved lower once again and made a Year to Date low of 10440.64 on October 13th. Since then, the NASDAQ 100 has been slowly moving higher, reached a near-term high of 11681.85 on October 25th.
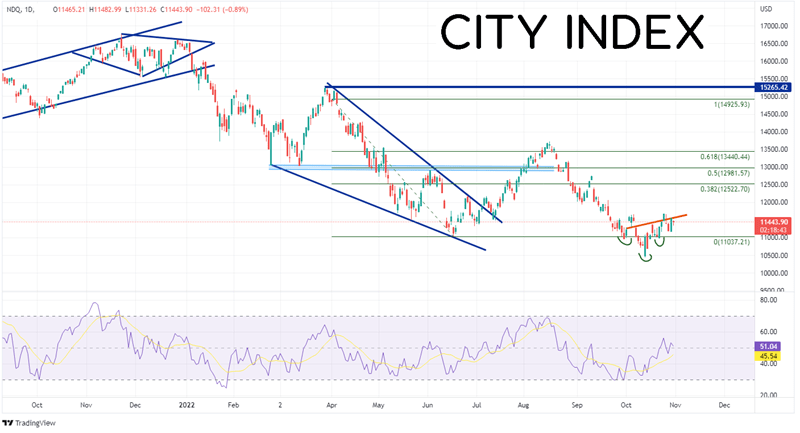
Source: Tradingview, Stone X
Trade the NASDAQ 100 now: Login or Open a new account!
• Open an account in the UK
• Open an account in Australia
• Open an account in Singapore
On a 240-minute timeframe, the NASDAQ 100 made its low on October 13th as the RSI was diverging with price. In doing to, the tech index formed an inverse head and shoulders, with the neckline at the 38.2% Fibonacci retracement level from the highs of August 16th to the lows of October 13th, near 11693.70. The target for the chart pattern is near 13000. If the NASDAQ 100 trades above the neckline, there is a confluence of resistance at the highs of September 21st and the 50% retracement level from the same timeframe near 12080.78, then the gap opening between September 12th and 13th at 12427.62. However, if price fails to break above the resistance, the first support level is the lows from October 21st at 10977.52, the gap fill from October 14th at 10802, then the lows of October 13th at 10440.64.
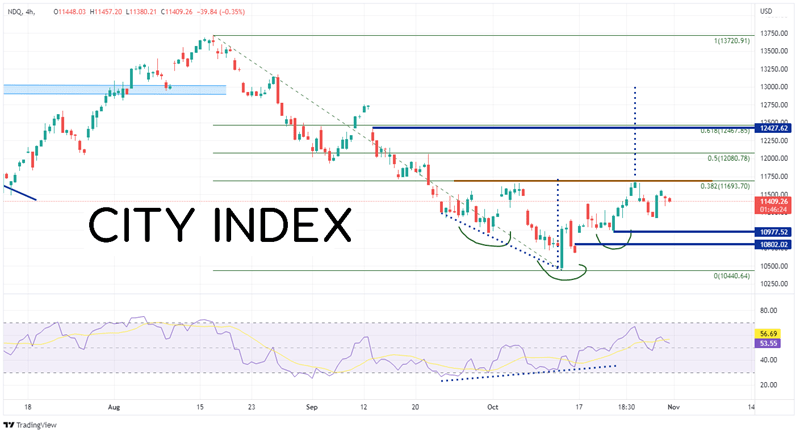
Source: Tradingview, Stone X
Will the FOMC cut back on the pace of rate hikes? Will big tech earnings continue to come out poorly and guidance continued to be revised lower? The NASDAQ 100 is at an important technical level. If it breaks higher out of the inverted head and shoulders pattern, price could be on its way to near 13,000. However, if it fails, price could be back at the recent lows heading into the end of the year!
Learn more about index trading opportunities.
Latest market news
Yesterday 01:32 PM
Yesterday 09:35 AM
Yesterday 07:23 AM
Yesterday 04:48 AM
Yesterday 12:17 AM
July 25, 2024 10:39 PM
Latest Trade Ideas articles

Yesterday 09:35 AM

Yesterday 12:17 AM

July 25, 2024 10:39 PM

July 25, 2024 05:30 PM