


- Metals rally as US dollar drops despite hot inflation
- Silver analysis: grey metal nears $25, but still miles from record
- Gold could be heading to a new record high
- Copper breaks above $4 on optimism about Chinese demand
Video: Gold, Copper and Silver analysis plus insights into FX majors and indices
As highlighted in my earlier report, the US dollar was looking bearish given that it was not responding in the way you'd expect it to, following the release of stronger-than-expected CPI report on Tuesday. The US dollar ‘should’ be finding support, but it isn't. This is suggesting that the market is expecting the Fed to cut interest rates anyway in June and potentially a few more times before the year is out. For this reason and the fact that there’s optimism about Chinese demand recovery, we have seen metal prices like copper and silver break out today, with the former rising above $4.00 and the latter nearing $25 per ounce. Silver is looking increasingly bullish when you look at the charts, all pointing to a potential breakout in the footsteps of gold.
Metals rally as US dollar drops despite hot inflation
One of the main reasons why precious metals have rebounded is to do with the US dollar. Despite the core CPI edging up by 0.4% in February, slightly higher than anticipated, Federal Reserve Chair Jerome Powell's optimistic view on inflation continues to resonate positively with traders. However, the market's response hasn't been as exuberant as in the past when confronted with similar inflation surprises. It appears that traders are still holding onto Powell's less hawkish tone, which has led to speculation about potential rate cuts in June while also tempering the market's reaction.
Silver analysis: grey metal nears $25, but still miles from record
Silver bounced back after yesterday's CPI-related drop and crucially it held support right where it needed to at around $24.20 to $24.00, the round figure, which was previously resistance and support.
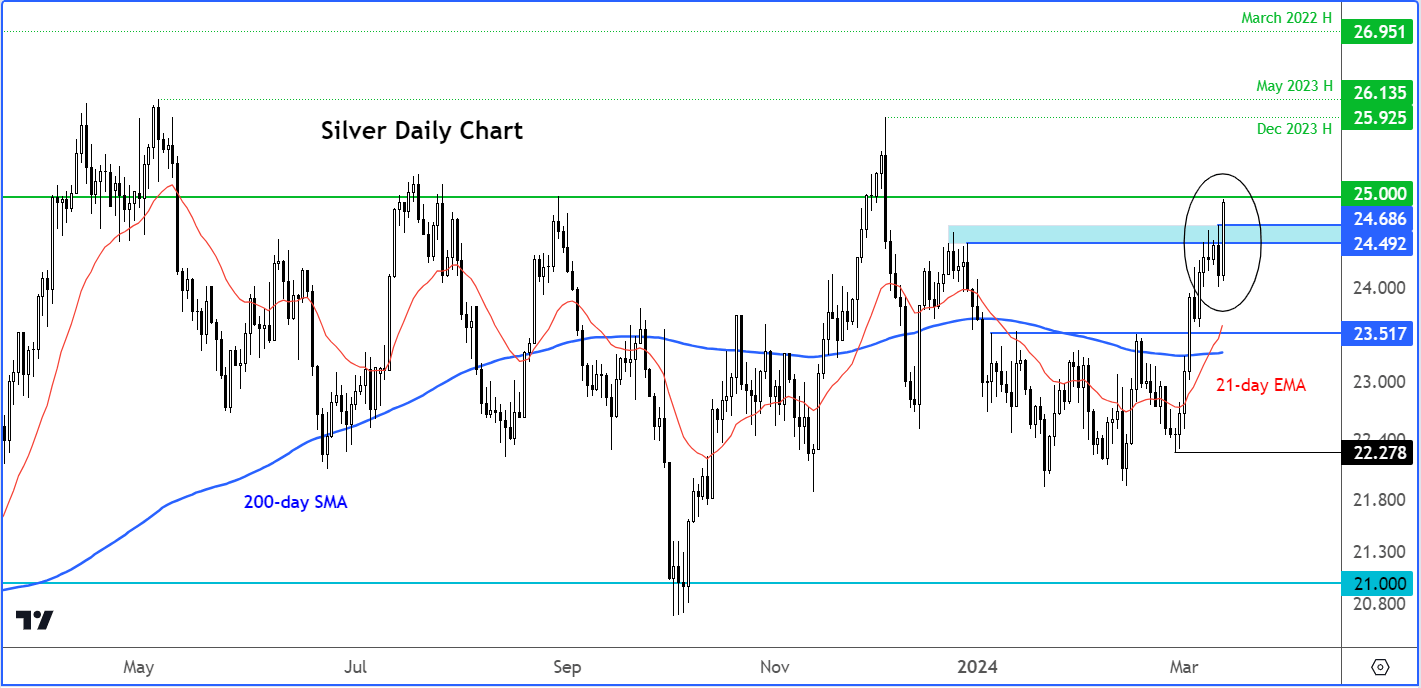
Previously, silver had been in consolidation before breaking out and it's now tracking gold prices higher. Still, it remains miles away from where it should be relative to gold in so far as the historical levels are concerned.
Indeed, if you see the monthly time frame chart, silver is about $25 or 100% away its record high that was hit in 2011 at just under $50.
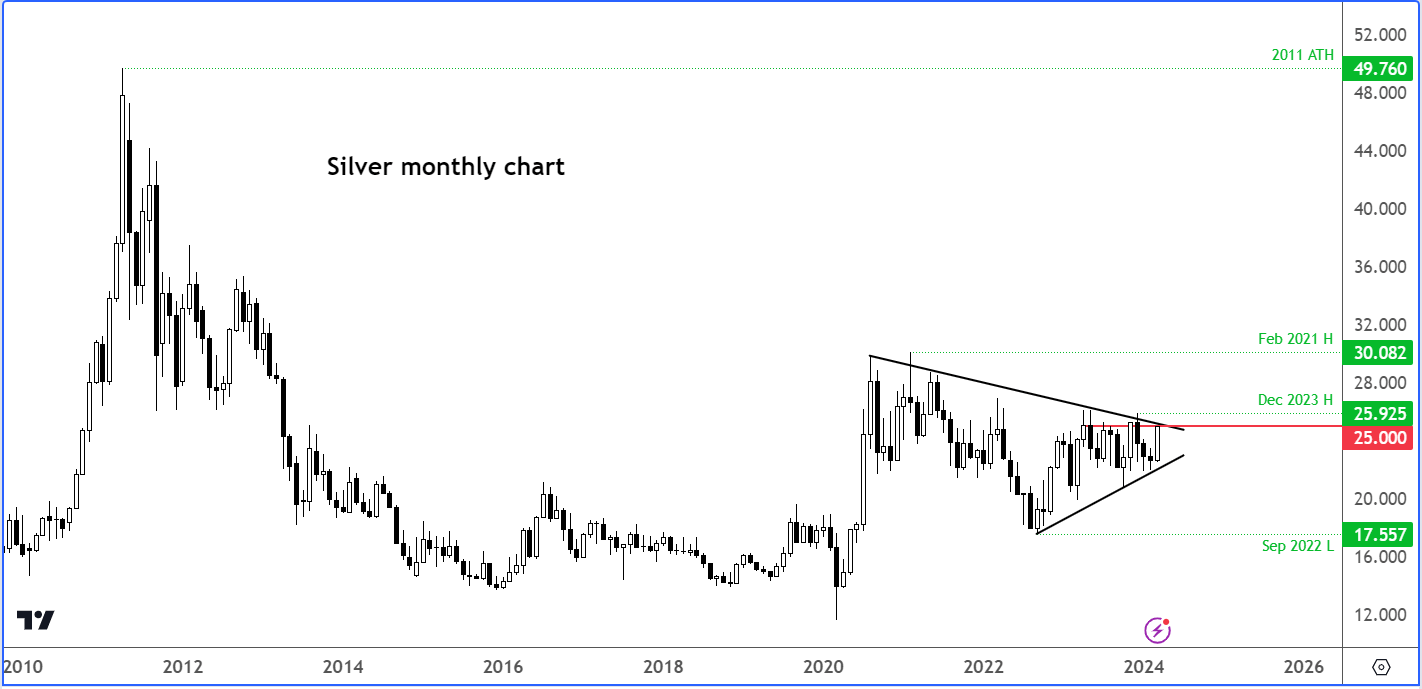
But it could be gearing up for a potential breakout in the not too distant future. This month, silver is up around 8% at the moment and counting.
So, the motion higher could well have started this month. But let's see if it will be able to break out more decisively this time because in recent years it has failed every time it's got around the $25-$26 area, before going down.
A clean break above the $25 to $26 area could be significant in so far as the long term trends are concerned.

Gold analysis: yellow metal could be heading to a new record high
Gold is looking strong. Yesterday it sold off on the back of the CPI report but held support above the December’s old record high of $2146 and around short-term support in the $2150 area.
With gold hitting repeated all-time highs, the momentum is clearly still bullish on the metal and more gains could be on the way.
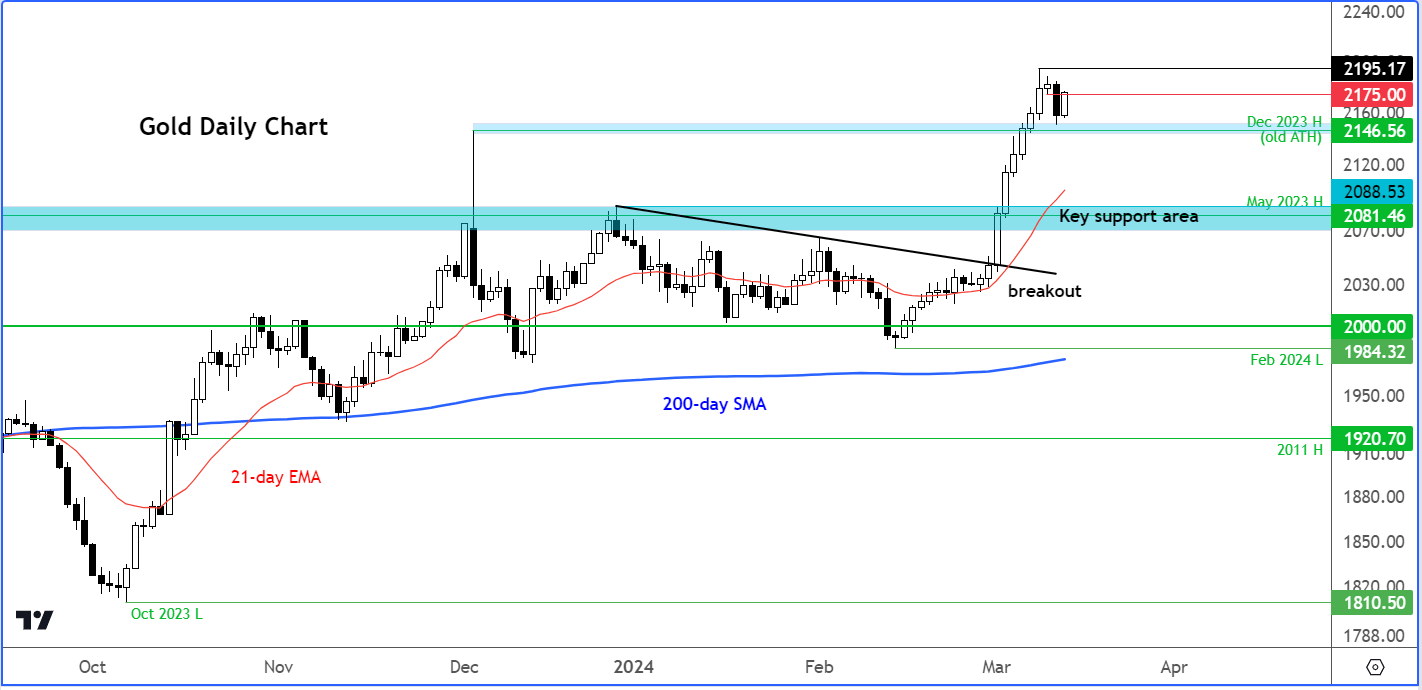
The next level to watch is at $2175, which was the base of the breakdown on Tuesday. Should we go above that level then that could pave the way for gold to potentially rally to new record highs.
Meanwhile, even if support breaks down below this area that I had just highlighted, there is significant further support seen around the $2080 area which was significant resistance in the past.
So, both the short-term and long-term technical indications point higher for gold.
Copper analysis: Red metal breaks out above $4
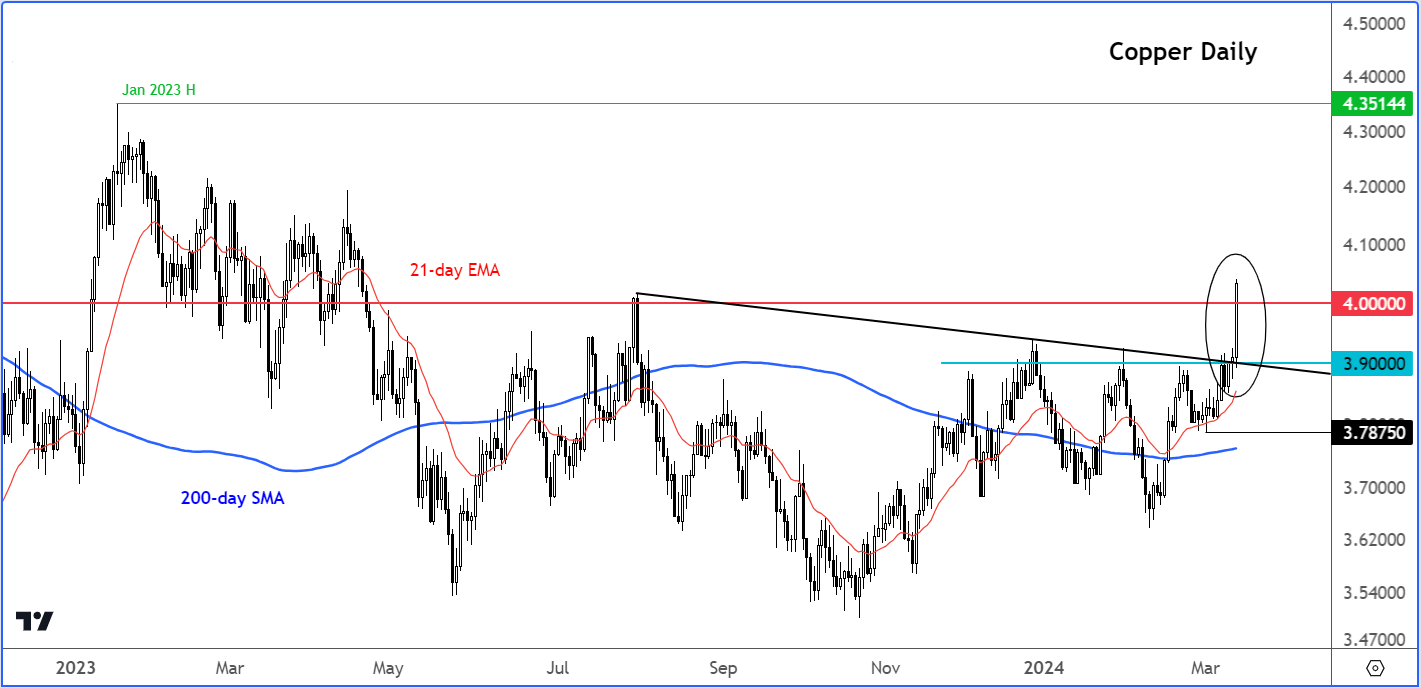
Copper has broken out cleanly above this bearish trend line and its consolidation pattern to the upside. It has risen above $4.00. This is clearly good news for commodity stocks - plenty of which found in the FTSE (hence, why the UK stocks index has been rising sharply of late).
Source for all charts used in this article: TradingView.com
-- Written by Fawad Razaqzada, Market Analyst
Follow Fawad on Twitter @Trader_F_R
How to trade with City Index
You can trade with City Index by following these four easy steps:
-
Open an account, or log in if you’re already a customer
• Open an account in the UK
• Open an account in Australia
• Open an account in Singapore
- Search for the company you want to trade in our award-winning platform
- Choose your position and size, and your stop and limit levels
- Place the trade
Latest market news
April 25, 2024 03:09 PM
April 25, 2024 03:00 PM
April 25, 2024 01:12 PM
Latest Gold articles

April 1, 2024 01:09 PM

March 28, 2024 10:30 AM

March 26, 2024 11:24 PM

March 26, 2024 12:00 PM