


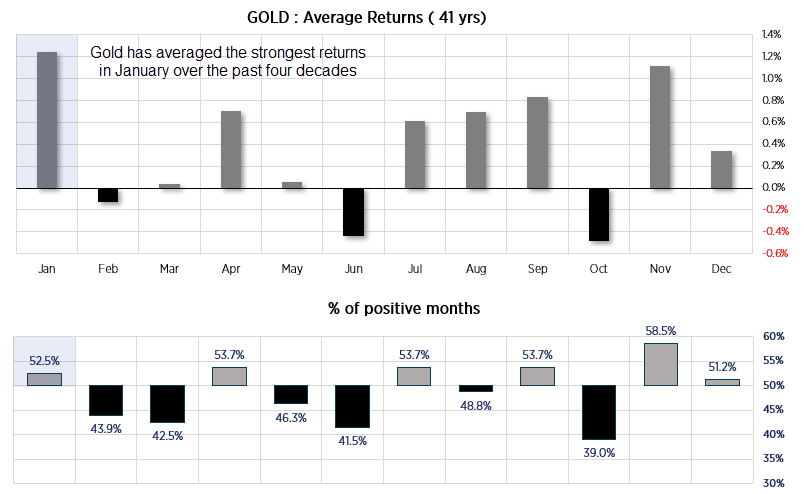
January is usually a decent month for gold prices looking at this seasonality chart, as it has averaged the strongest returns over the past four decades with a 52.5% win rate. The data shows that gold has risen in January ten of the past eight years and has also had a positive win rate (above 50%) alongside positive returns over the past 5, 10, 15 and 30 years averaged.
However, there are three potential factors which could dent the upside potential for gold this month.
- Markets are pricing in aggressive Fed rates cuts, which could be scaled back if data remains firm (and send gold lower).While Fed cuts seem likely, 140 bps could still be overly optimistic in my view. Core CPI is still roughly twice the Fed's target and employment data remains strong - even if the ISM services PMI is rolling over. So unless the economy rolls over, perhaps 75 - 100 bps of Fed cuts are more realistic.
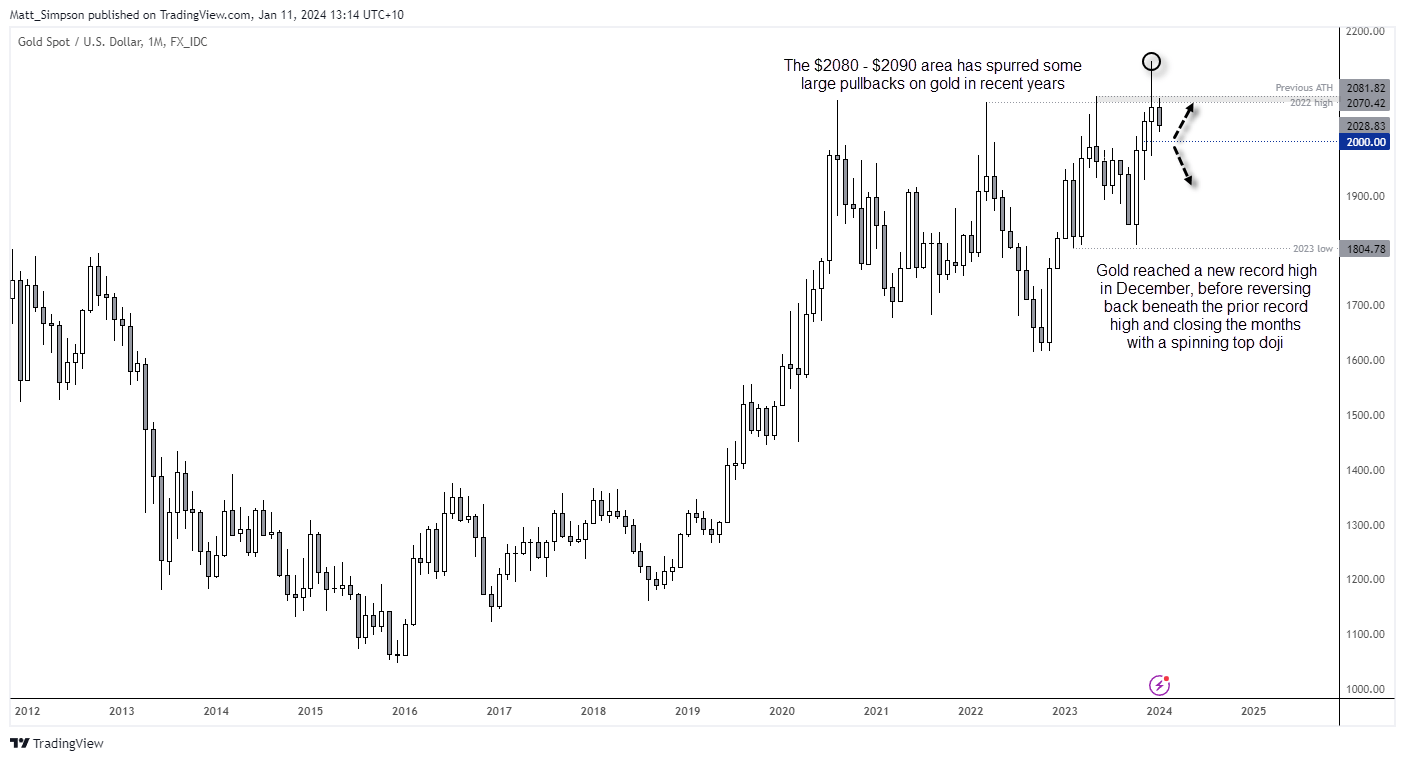
- Gold rallied each month in Q4 to suggest its seasonality came a little early.
- Gold reached a record high in December before reversing gains and closing the month with a spinning top (potential reversal candle) beneath the previous record high. Prices are now retracing in January and show the potential to pull back to at least $2000 – a break beneath which signals a deeper pullback.
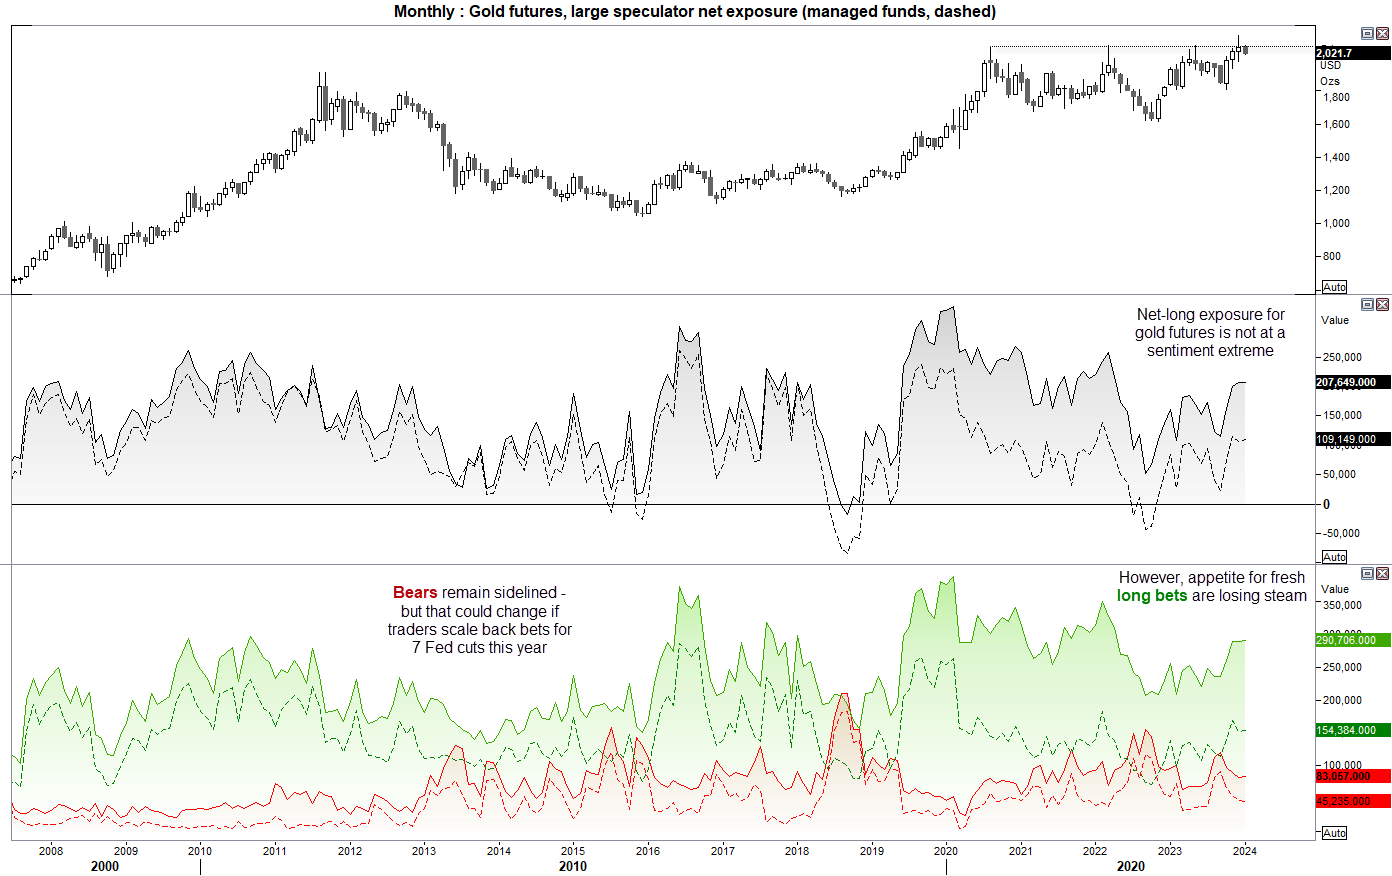
Gold: Trader positioning from the weekly COT report
Large speculators and managed funds remain net-long gold futures, although their appetite for fresh long bets have dwindled. Gross long positioning for managed funds remains beneath the early December peak, and large speculators seem hesitant to commit to 300k long contracts.
Given gold prices have retraced from their record highs set in December then it seems feasible to believe some gold bugs remain sidelined or are considering closing out more of their bullish bets. But what we need to watch it for in the coming weeks is whether gross shorts begin to rise, as this indicates a much deeper pullback for gold prices. And a likely threat for such a move is if markets take seriously that 7 cuts are not coming this year.
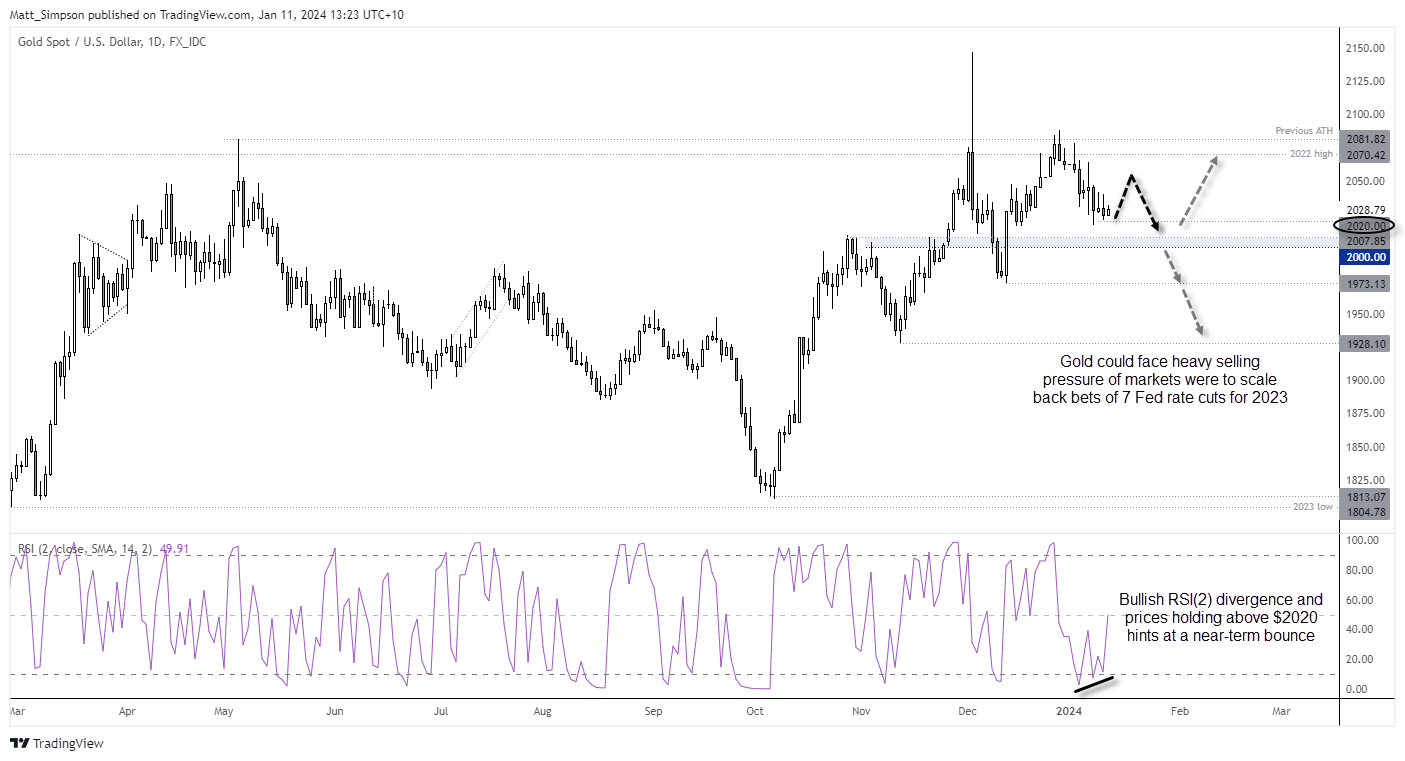
Gold technical analysis (daily chart):
A prominent peak formed on gold early December, and any attempt to recapture the highs have stalled around the $2080 level. Since then, gold has retraced around -3% but managed to hold above the $2020 level on the daily chart – despite bears failed attempts for a daily close beneath it.
With expectations for inflation to tick higher in December's data, the contrarian in me wonders if we'll see inflation undershoot estimates and for gold to continue higher this week. Technically, RSI (2) formed a bullish divergence and is now on the cusp of breaking above 50 which hints at a technical bounce.
However, my bias is for any such bounce to be short lived and to head towards the $2000 support zone. And if data remains resilient overall for the US, seven rate cuts seems overly optimistic which could prompt traders to reassess their bets and send gold below $2000 and bring the $1973 low into focus.
-- Written by Matt Simpson
Follow Matt on Twitter @cLeverEdge
How to trade with City Index
You can trade with City Index by following these four easy steps:
-
Open an account, or log in if you’re already a customer
• Open an account in the UK
• Open an account in Australia
• Open an account in Singapore
- Search for the market you want to trade in our award-winning platform
- Choose your position and size, and your stop and limit levels
- Place the trade
Latest market news
Yesterday 01:32 PM
Yesterday 09:35 AM
Yesterday 07:23 AM
Yesterday 04:48 AM
Yesterday 12:17 AM
July 25, 2024 10:39 PM
Latest Trade Ideas articles

Yesterday 09:35 AM

Yesterday 12:17 AM

July 25, 2024 10:39 PM

July 25, 2024 05:30 PM