


- Gold has surged nearly $200 during October
- Elevated risk aversion has helped but the move has come despite soaring real bond yields and continued US dollar strength
- Long positioning does not look stretched in futures markets
- Gold has already hit record highs against many currencies such as JPY, CNH, AUD and EUR
It’s hard not to like gold in an environment of heightened geopolitical tension, soaring government budget deficits and elevated mining costs, potentially limiting supply from marginal producers. And when you consider how strong the US dollar is right now, with bond yields hitting levels not seen since before the global financial crisis, it comes as no surprise traders are pondering whether gold is destined for record highs given it’s performing so strongly at a time when it would traditionally be struggling. It’s already hit record territory against the Japanese yen, Australian dollars, euros, Chinese yuan and most other emerging market currencies, so why not the US dollar?
Gold behaving like a true safe haven
US dollars, Swiss francs, US Treasuries and gold; when you think of safe havens as a store of value in times of economic and market turmoil, these are the names that immediately come to mind. However, in the current episode of geopolitical tensions, gold has stood out for being the only name to live up to its reputation, starring at a time when the US dollar and Treasuries have looked anything but rock-solid. While not to say these instruments have lost their haven status, when it comes to what traders and investors can trust should we see a further deterioration in the macroeconomic landscape, gold has runs on the board whereas others don’t.
Long positioning in gold not stretched
As pointed out by Matt Simpson in his analysis of the US CFTC’s latest Commitment of Traders’ (COT) report, while real money and speculator accounts have added to long gold positions in recent weeks, net long positioning is hardly extreme relative to historic standards, suggesting sentiment is yet to hit euphoric levels where the risk of abrupt and large reversals is generally elevated.
Gold is defying traditional headwinds
Perhaps the most impressive thing about gold’s recent performance is that it’s come despite soaring nominal and real bond yields, something that has traditionally hindered gold given it does not provide a yield and often has carrying costs if we’re talking physical bullion.
The chart below shows the performance of gold (red line) relative to shifts in real, inflation-adjusted US 10-year bond yields. The scale for the latter has been inverted to show how the relationship between the two markets has broken down. You can see going back two decades that when real yields fell, gold tends to push higher, and vice versus.
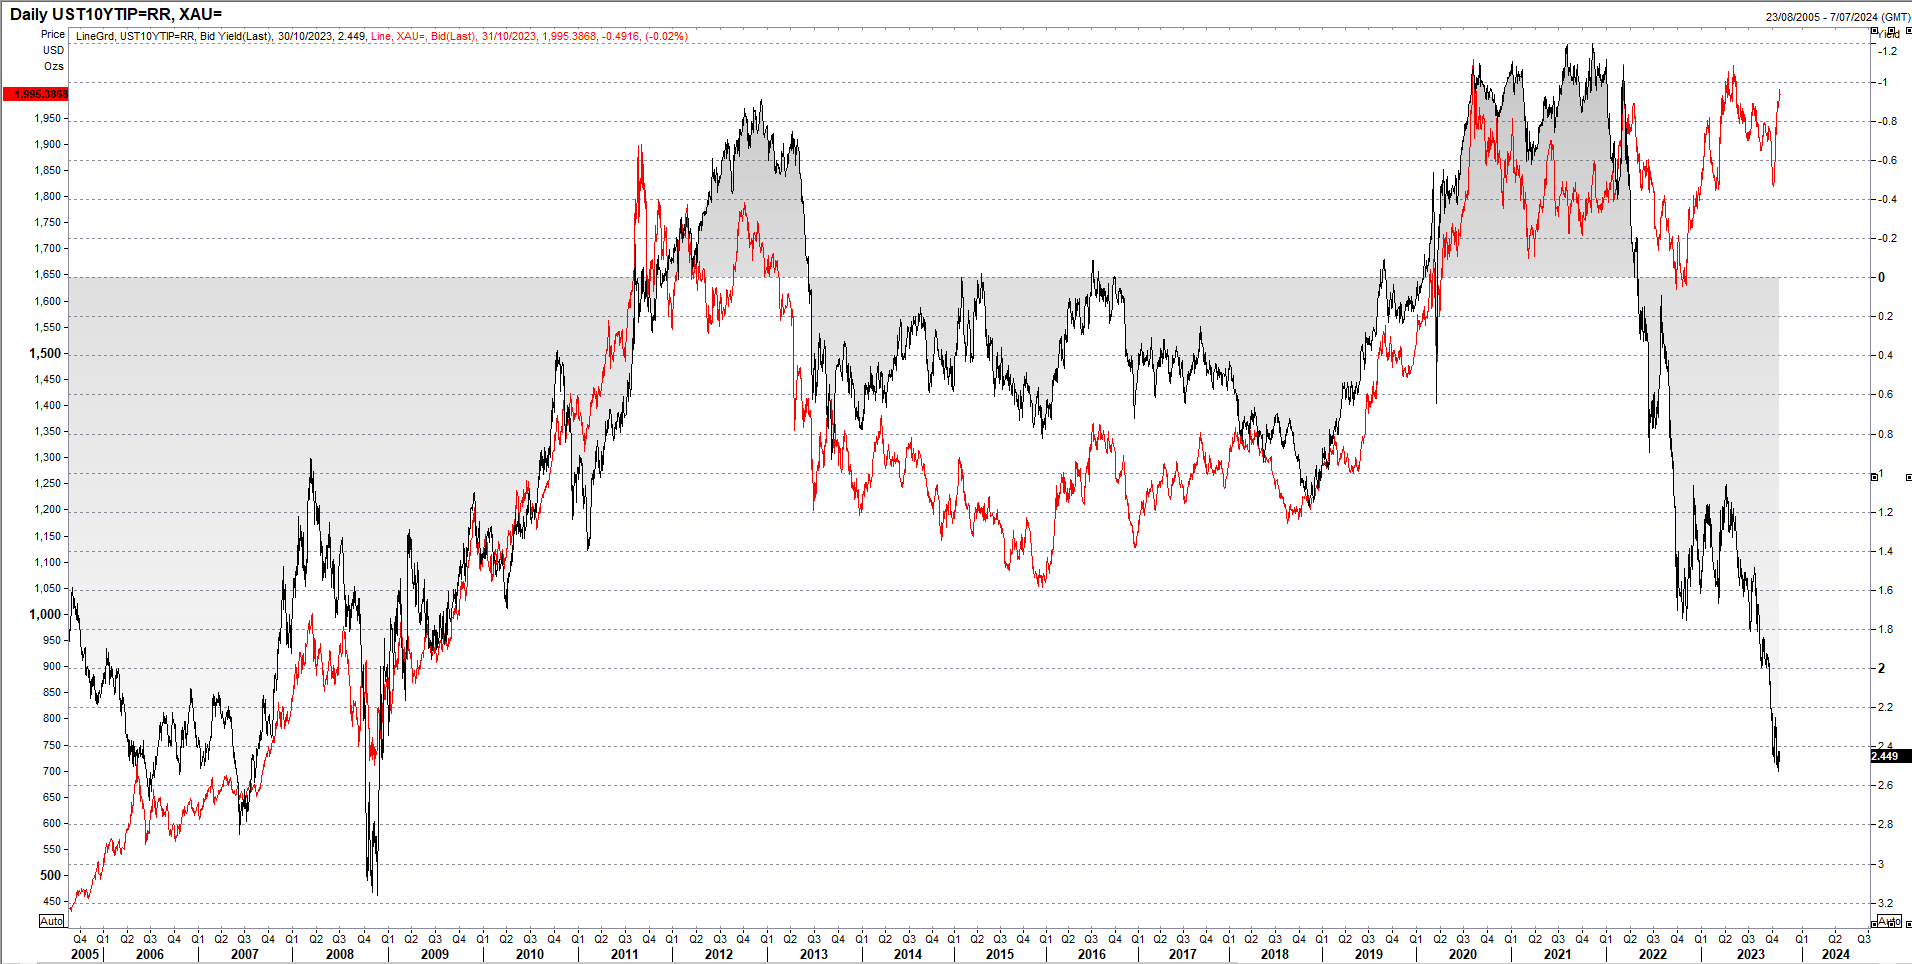
Source: Refinitiv
Normally, when real yields offer risk-free returns of this magnitude, gold would be getting hammered. For instance, when 10-year real yields were last trading at 2.45%, gold was trading near $750 per ounce, not the near $2000 level where it sits today. For now, the relationship looks to have broken down, potentially reflecting concerns about the US fiscal trajectory which has seen investors demand greater compensation for funding the US government, especially longer-term debt.
When you consider the US dollar is also strong right now, creating headwinds for assets price in the currency, you could only imagine how gold would perform in an environment of falling real yields and a softer US dollar.
Gold technical picture
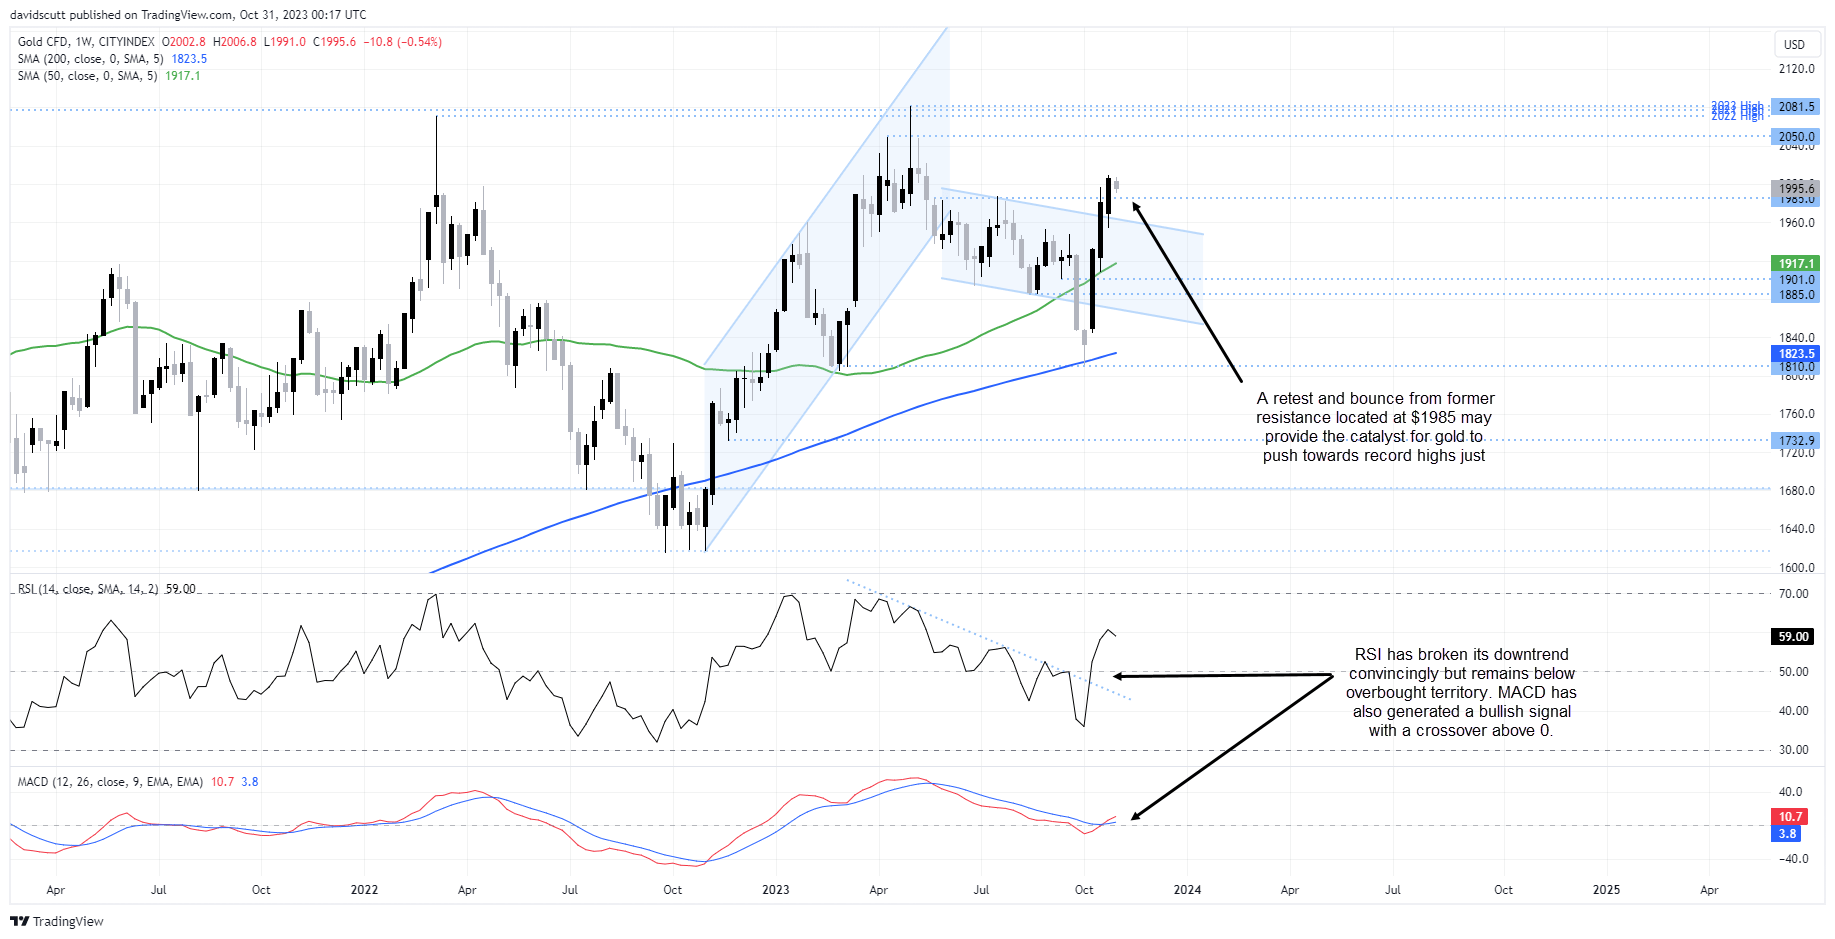
Looking at gold on the weekly chart, you can see the explosive move during October, seeing the price bounce strongly from support at the intersection of the 200-week moving average and horizontal support found at $1810, taking it all the way back to over $2000 late last week.
The abrupt bounce has seen RSI break its downtrend convincingly, signaling a shift in momentum to the upside. However, despite the velocity of the move, RSI is not yet sitting at overbought levels. MACD has also recorded a bullish crossover, adding to the improved technical picture for potential upside.
Having broken $2000 only to pull back below the figure, traders will be eyeing a retest of former resistance located at $1985. If this reverts to support and holds, it may provide the impetus for fresh longs to move in targeting a potential move back towards record highs hit earlier this year. Stop loss orders below this level will provide protection against a more pronounced reversal.
On the topside, $2050 would be the initial target before a potential retest of the 2023 record high just above $2080 should the former give way.
-- Written by David Scutt
Follow David on Twitter @scutty
How to trade with City Index
You can trade with City Index by following these four easy steps:
-
Open an account, or log in if you’re already a customer
• Open an account in the UK
• Open an account in Australia
• Open an account in Singapore
- Search for the market you want to trade in our award-winning platform
- Choose your position and size, and your stop and limit levels
- Place the trade
Latest market news
Yesterday 01:32 PM
Yesterday 09:35 AM
Yesterday 07:23 AM
Yesterday 04:48 AM
Yesterday 12:17 AM
July 25, 2024 10:39 PM
Latest Gold articles

July 22, 2024 02:47 AM

July 15, 2024 01:00 AM

July 9, 2024 02:32 AM

July 4, 2024 02:30 PM