


- Gold analysis: Weaker start in November follows 7% rise in October
- Peak interest rates narrative could help precious metals
- Gold-silver ratio falls from key resistance
Precious metals prices have weakened over the last couple of weeks, following gold’s impressive +7% gains in October, and silver’s not-so-impressive 3% rise. Last month’s gains for gold were mostly driven by safe-haven demand as the flare up in the Middle East conflict saw investors rush out of risk-sensitive assets. The precious metal rallied last month even as US bond yields hit fresh 2007 highs. At the start of this month, we have seen yields drop back sharply but this has not had any positive impact on gold prices yet. Investors have perhaps found stocks and bonds as better investment propositions than gold, with the latter paying no dividends or interest, and costing money to store. What’s more, with signs of peak inflation around the world, and gold prices being not too far off their record levels, some investors are not comfortable buying gold at these prices and are thus waiting for a deeper pullback before potentially pulling the trigger. However, with yields declining dip-buyers are lurking. So, be on the watch out for a bullish reversal as both gold and silver test key support levels. I am of the view that silver has more upside potential than gold from here.
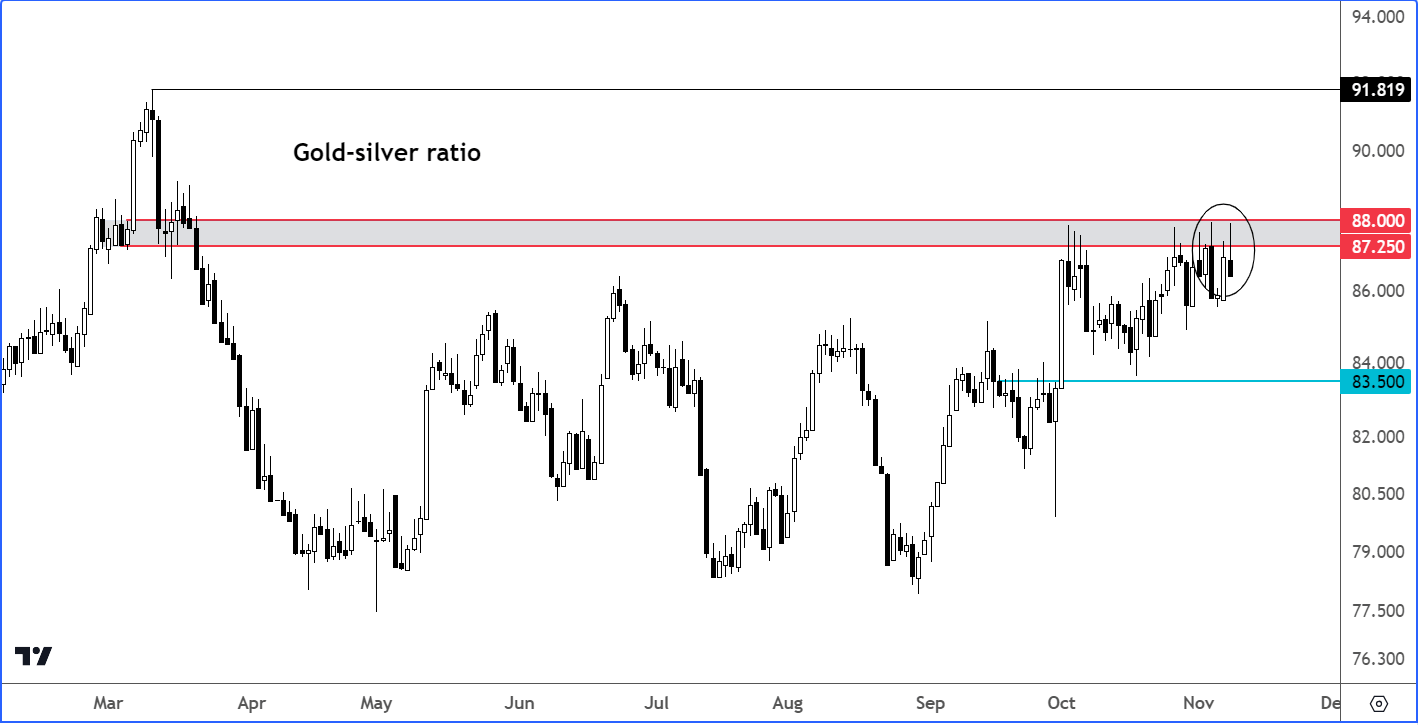
Gold silver ratio falls from key resistance
Supporting my thesis that silver may outperform gold, the gold-silver ratio has been banging at overhead resistance around the 87.25 to 88.00 range in the past couple of weeks, following the big rally in September and October. So far, resistance has held here, suggesting that silver could be about to outshine gold on the long side, or fall less than the yellow metal in the case of a sell-off.
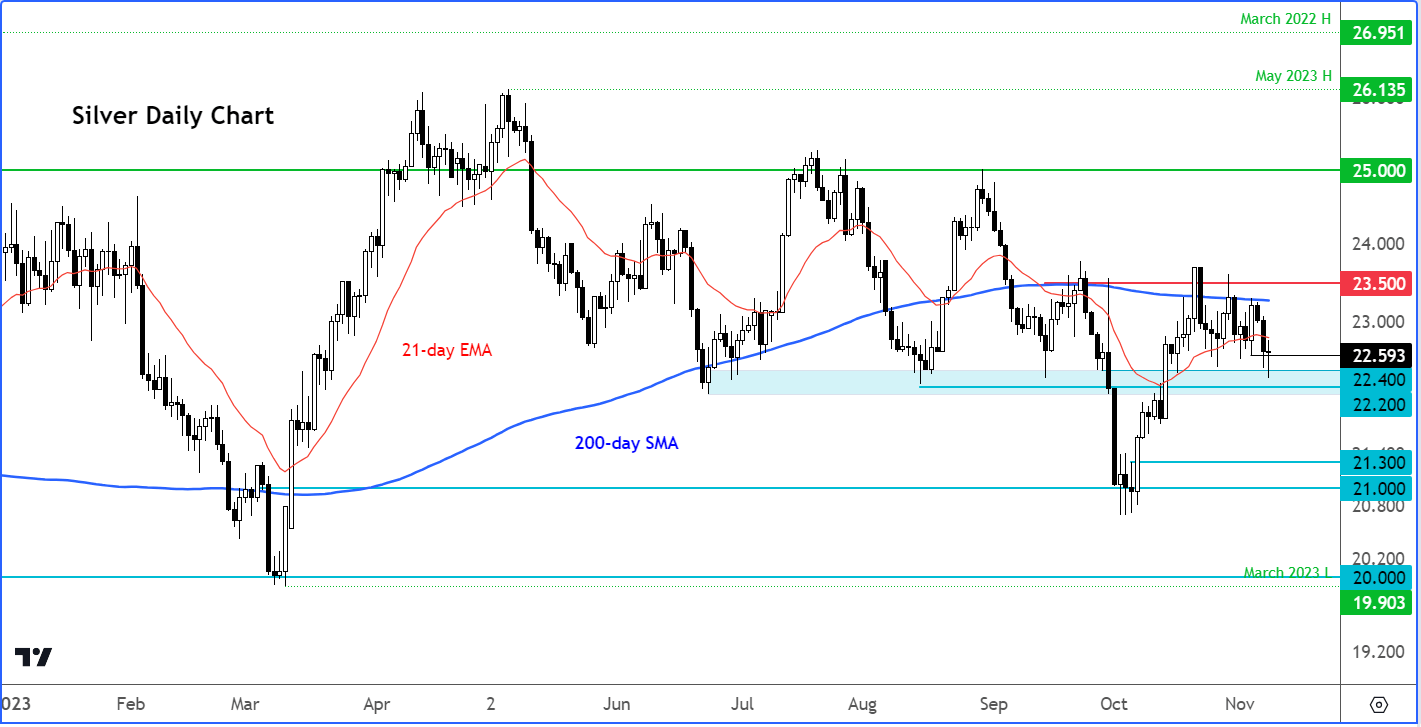
Silver technical analysis
At the time of writing, silver was down for the third day, but off its earlier lows after testing the top of the key short-term support range between 22.20 and 22.40. This area had been support in the past before a sharp breakdown in October below here failed to materialise into anything major. Consequently, silver bulls quickly reclaimed their lost ground and are now trying to defend it again as price tests this zone from up above. What we want to see here from a bullish point of view is the formation of a bullish-looking candle on the daily time frame to provide the green signal for the bulls waiting to jump on board. If such a signal is not seen, then the wait must continue given that there is no clear directional bias on silver prices at the moment, and given the fact that silver is below the 200-day average.
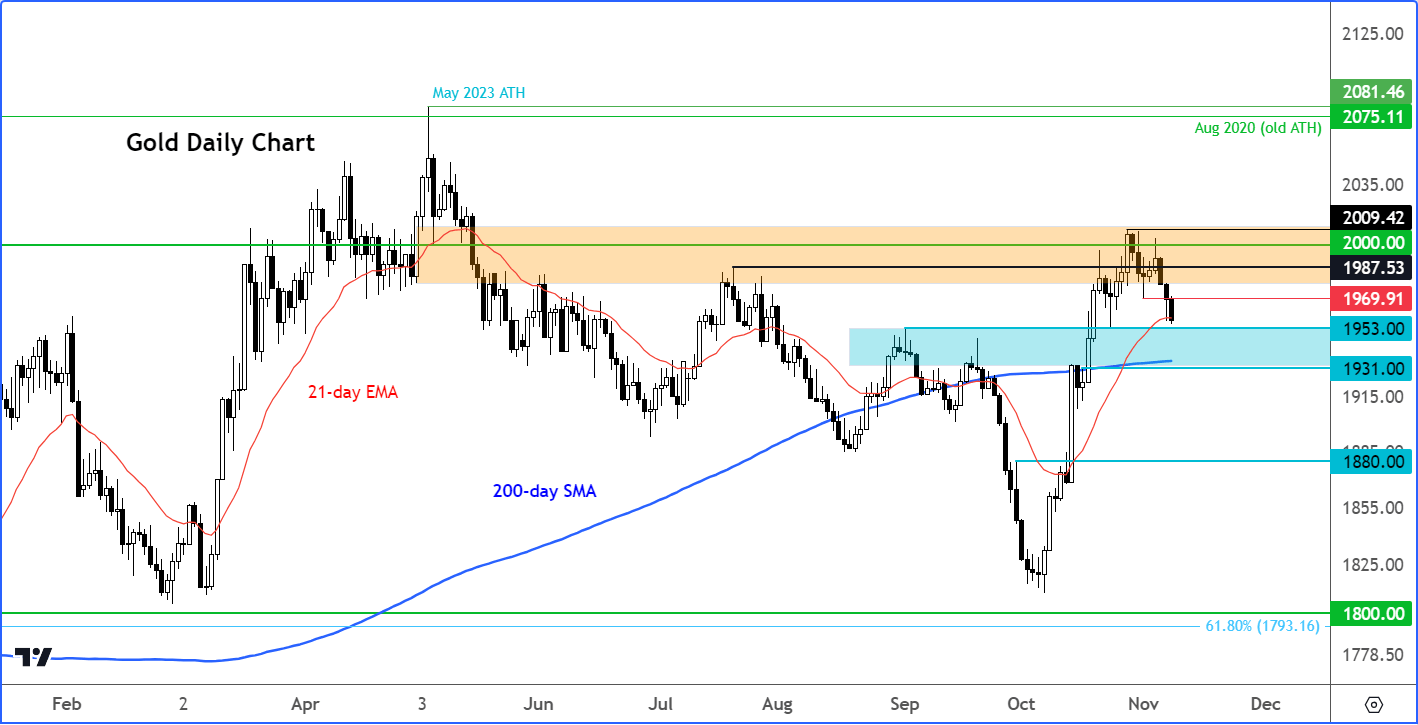
Gold technical analysis
The key area of support for gold is seen between $1931 to $1953, which I have shaded in blue on my chart. This area was previously resistance on a few occasions between August and September. Now that gold has broken above this zone, it better hold here for the bulls to maintain control. We have the 200-day average also cutting through this zone. A potential break below here on a daily closing basis would be a bearish development.
Source for all charts used in this article: TradingView.com
-- Written by Fawad Razaqzada, Market Analyst
Follow Fawad on Twitter @Trader_F_R
How to trade with City Index
You can trade with City Index by following these four easy steps:
-
Open an account, or log in if you’re already a customer
• Open an account in the UK
• Open an account in Australia
• Open an account in Singapore
- Search for the company you want to trade in our award-winning platform
- Choose your position and size, and your stop and limit levels
- Place the trade
Latest market news
Yesterday 01:32 PM
Yesterday 09:35 AM
Yesterday 07:23 AM
Yesterday 04:48 AM
Yesterday 12:17 AM
July 25, 2024 10:39 PM
Latest Gold articles

July 22, 2024 02:47 AM

July 15, 2024 01:00 AM

July 9, 2024 02:32 AM

July 4, 2024 02:30 PM