


February 3, 2023 7:03 AM
Four guys walk into a bar before central bank meetings. The first guy buys US Dollars. After an “as expected” FOMC statement and a less hawkish press conference by Fed Chairman Powell including comments that “the disinflationary process has started”, he sells the US Dollars. The second guy buys British Pounds. But after a less hawkish BOE statement and comments from Bank of England Governor Bailey that “We’ve seen the first signs that inflation has turned a corner”, he sold his GBP. The third guy buys Euros. But after an “as expected” statement which signaled there would be one more rate hike in March (interpreted as the end of rate hikes) and contradictory comments from ECB President Lagarde, he sold his Euros. The fourth guy….he buys the Aussie. The RBA doesn’t meet until February 7th. Will he end up selling the Australian Dollar immediately following the RBA decision, just as the other 3 have sold their currencies?
Prior to the recent CPI report, markets were pricing in a 15bps hike. However, after the much higher than expected inflation report, some participants have moved their forecasts higher and are now expecting a 25bps rate hike. Regardless of the result, will the RBA signal that they are going to pause the rate hike cycle? What does that mean for the Aussie?
On a daily timeframe, AUD/USD has been moving higher in an ascending wedge formation since making lows in October 2022 at 0.6170. Since then, the pair has been moving aggressively higher due to high inflation and the termination of China’s zero-covid policy. Indeed, this was good news for the AUD/USD as the pair recently moved above the top trendline of the ascending wedge, spiked above August 2022 highs, and is currently oscillating around the 61.8% Fibonacci retracement level from the highs of January 2022 to the lows of October 2022 near 0.7092.
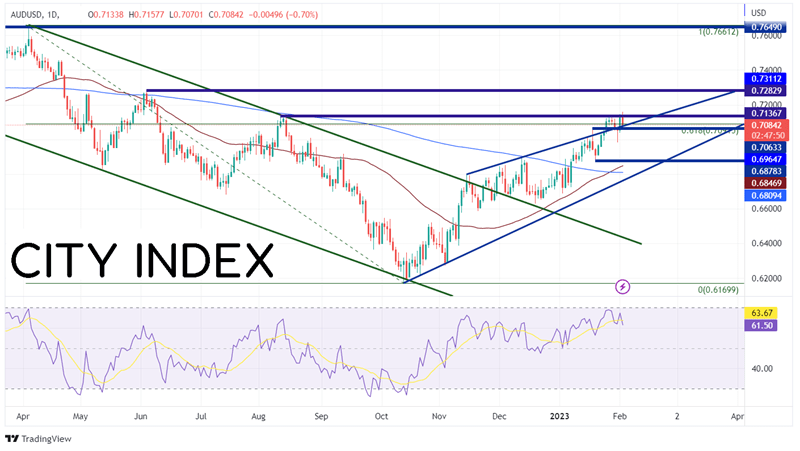
Source: Tradingview, Stone X
Trade AUD/USD now: Login or Open a new account!
• Open an account in the UK
• Open an account in Australia
• Open an account in Singapore
On a shorter-term, 240-minute timeframe, AUD/USD has formed a smaller ascending wedge. Expectations are that price will break lower from an ascending wedge and retrace 100%. However, on the daily timeframe, price broke above the pattern. Will price break above the 240-minute wedge as well? And if so, how much higher will price move? First resistance is at Thursday’s highs of 0.7158, which is also the top trendline of the wedge. However, if price breaks above there, it can run to the highs of June 3rd, 2022 at 0.7283! If price proves to be a false breakout of the ascending wedge on the long-term timeframe and breaks the bottom trendline of the current wedge, the first support level is at the lows from January 31st at 0.6984. Below there, price can fall to the lows from January 19th at 0.6884, then the 50 Day Moving Average at 0.6847 (see daily).
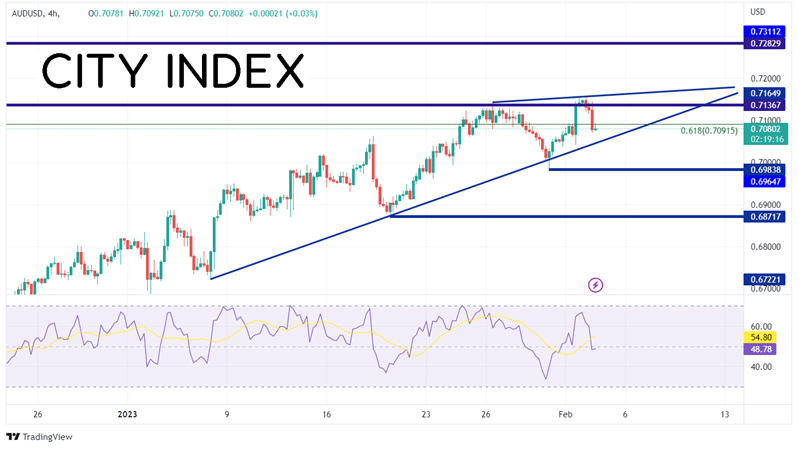
Source: Tradingview, Stone X
So, will the guy who bought Aussie end up like his friends who sold their currencies after their respective central bank meetings? It may depend on the volatility of the US Dollar after the Non-Farm Payrolls tomorrow. But, perhaps he will see a “buy the rumor, sell the fact” and get a chance to sell higher before the meeting, so he doesn’t end up like his buddies.
Learn more about forex trading opportunities.
Latest market news
Yesterday 01:32 PM
Yesterday 09:35 AM
Yesterday 07:23 AM
Yesterday 04:48 AM
Yesterday 12:17 AM
July 25, 2024 10:39 PM
Latest Trade Ideas articles

Yesterday 09:35 AM

Yesterday 12:17 AM

July 25, 2024 10:39 PM

July 25, 2024 05:30 PM