


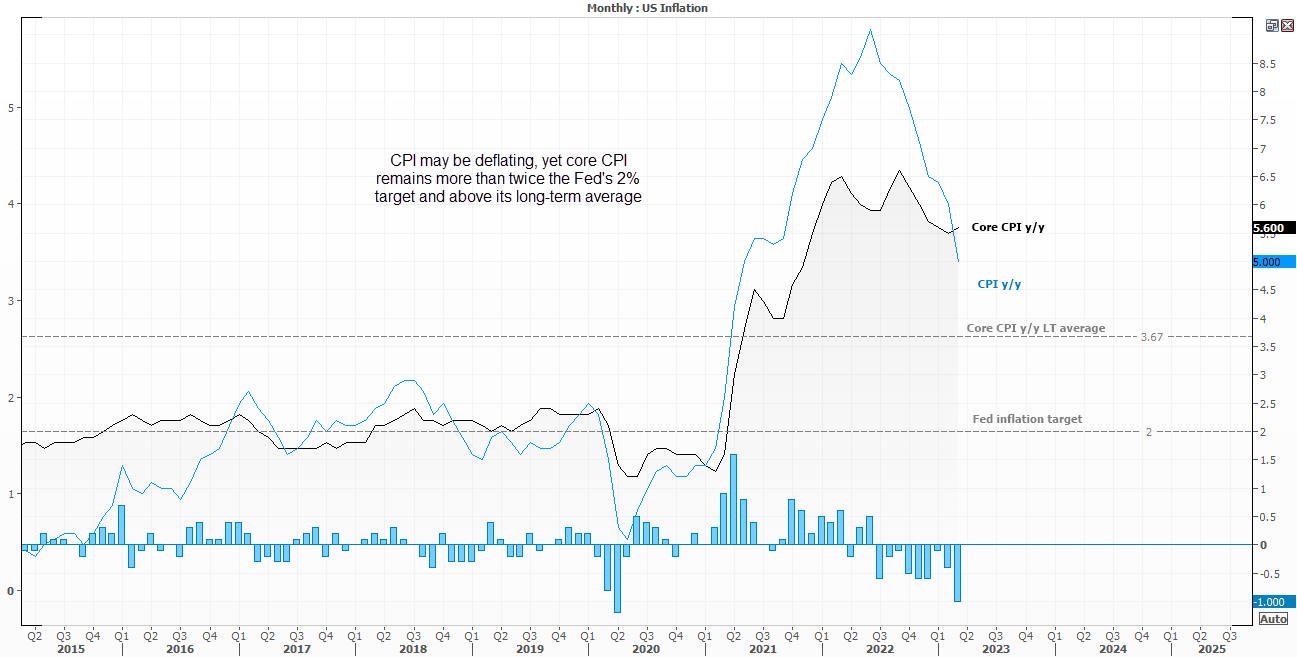
- US CPI fell to a 22-month low of 5%, down from 6% and beneath the 5.2% forecast
- CPI rose just 0.1% m/m
- However, core CPI rose to 5.6% as forecast, up from 5.6% prior
- Core CPI also remains elevated at 0.4% m/m
- We favour a 25bp Fed hike in May and hawkish comments from Fed members ahead of the ‘blackout’ period in nine days
- EUR/USD approaches YTD highs ahead of retail sales and US producer prices
- Several technical clues suggest a pullback before the euro breaks higher
The US dollar was the weakest major on Wednesday thanks to softer headline inflation, which allowed EUR/USD test 1.10 and USD/CHF fall to a near two-year low. With European data outperforming, inflation remaining elevated and the SNB likely to hike rates and support a stronger Swiss franc, traders are quick to jump onto soft US data and short the dollar against EUR and CHF. But with both EUR/USD and USD/CHF approaching key levels, we urge caution simply following this trend unless any breakout is backed up with data.
Besides, the initial reaction from the dollar was seemingly based on headline inflation which includes lower gasoline prices. And a look behind the headline number suggests a pause is not a slam dunk. Core inflation remains elevated and above long-term averages on both an annual and monthly basis, falling gas prices in March are likely temporary, oil prices are up ~30% from the March low and NFP churning out defiantly strong numbers. Furthermore, services inflation – a thorn in the side for central banks the world over – remains strong. And that’s why economists and markets remain as divided after the inflation report as they were prior.
As things stand, I suspect the Fed are more likely to hike than not in May given the rebound in oil prices, defiantly strong NFP data and sticky core inflation. And whilst we may see the dollar weaken should retail sales of producer prices soften tonight, the larger picture of a hawkish Fed and sticky core inflation remain. We also have nine trading days left before the Fed’s ‘blackout’ period kicks in, which leaves plenty of opportunity for them to steer expectations for their May meeting. And that leaves room for some dollar strength as we get closer to the Fed’s May meeting.
EUR/USD weekly chart:
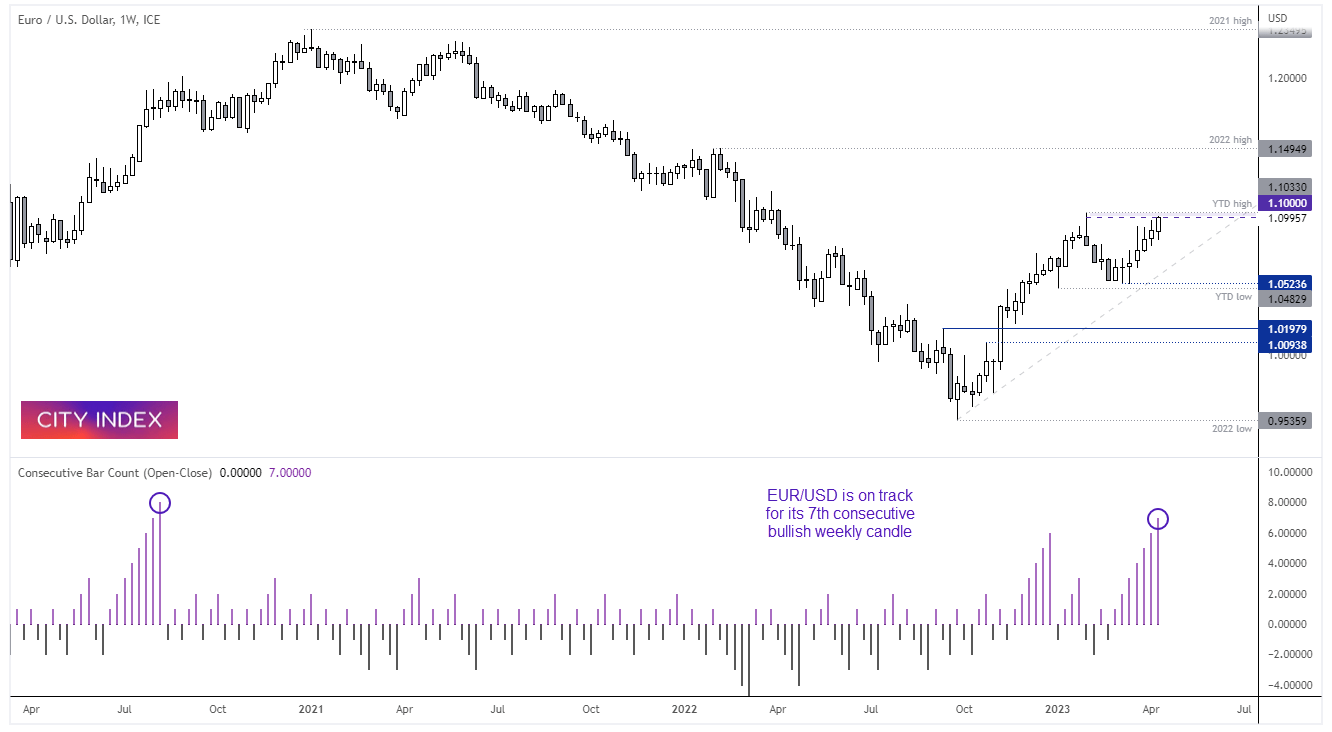
The euro is currently on track for its seventh consecutive bullish week, a sequence which has not been seen since August 2020. Whilst it does not guarantee a strong reversal lower, it does suggest its current rally is ‘long’ in the tooth as we approach the YTD high.
EUR/USD daily chart:
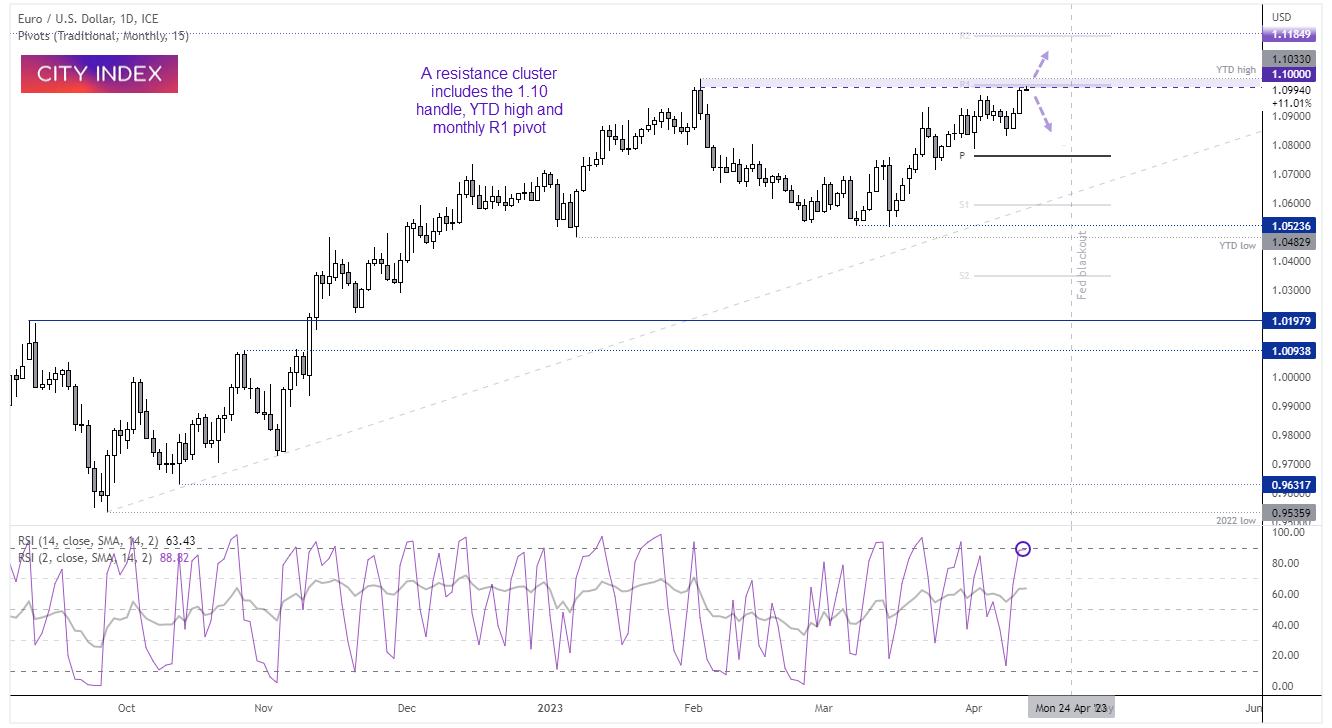
Still, we must concede that the euro is within an established uptrend on the daily chart and an upside break is a real possibility sooner or later. Bullish momentum has increased into resistance, which includes the 1.10 handle, 1.1033 YTD high and monthly R1 resistance. RSI (2) is on the cusp of overbought to warn of near-term weakness, although RSI (14) is not overbought and is confirming the underlying trend.
EUR/USD 4-hour chart:
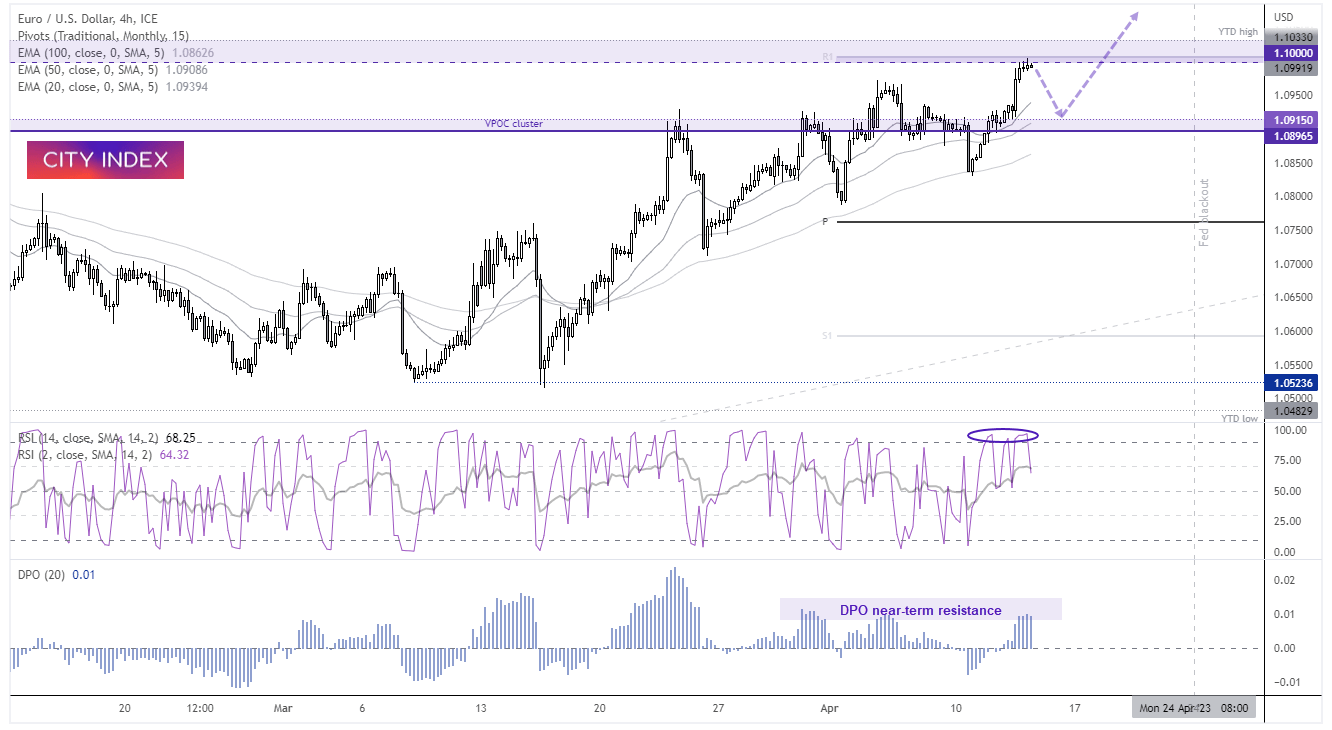
The 100-bar EMA has produced support since late March, and the 20, 50 and 100 EMA’s are in bullish order to show a healthy trend overall. Yet the DPO (detrended price oscillator) – which measures the distance from a moving average – has reached its own resistance area to suggest the recent rally has overextended. Furthermore, this carries more weigh given the resistance zone overhead, and the RSI (2) hitting overbought three times recently and RSI (14) also oversold.
From here we favour some mean reversion towards 1.0900, which sits near a cluster of historical VPOC’s (volume points of control). VPOCs can behave as a magnet, which makes them potential targets. Therefore our near-term bias remains bearish below 1.1035 and for a retracement to at least 1.0900, with the potential for a move to 1.0850 if it wants to retest the 100-bar EMA once more.
Beyond that point, we’d look for evidence of a swing low and for momentum to return to its bullish daily trend, which is confirmed with a break above 1.1035.
-- Written by Matt Simpson
Follow Matt on Twitter @cLeverEdge
How to trade with City Index
You can trade with City Index by following these four easy steps:
-
Open an account, or log in if you’re already a customer
• Open an account in the UK
• Open an account in Australia
• Open an account in Singapore
- Search for the market you want to trade in our award-winning platform
- Choose your position and size, and your stop and limit levels
- Place the trade
Latest market news
Yesterday 01:32 PM
Yesterday 09:35 AM
Yesterday 07:23 AM
Yesterday 04:48 AM
Yesterday 12:17 AM
July 25, 2024 10:39 PM
Latest Trade Ideas articles

Yesterday 09:35 AM

Yesterday 12:17 AM

July 25, 2024 10:39 PM

July 25, 2024 05:30 PM