


Asian Indices:
- Australia's ASX 200 index fell by -19.8 points (-0.27%) and currently trades at 7,278.70
- Japan's Nikkei 225 index has risen by 69.66 points (0.22%) and currently trades at 32,461.24
- Hong Kong's Hang Seng index has fallen by -382.41 points (-1.97%) and currently trades at 19,031.37
- China's A50 Index has fallen by -44.57 points (-0.35%) and currently trades at 12,601.28
UK and Europe:
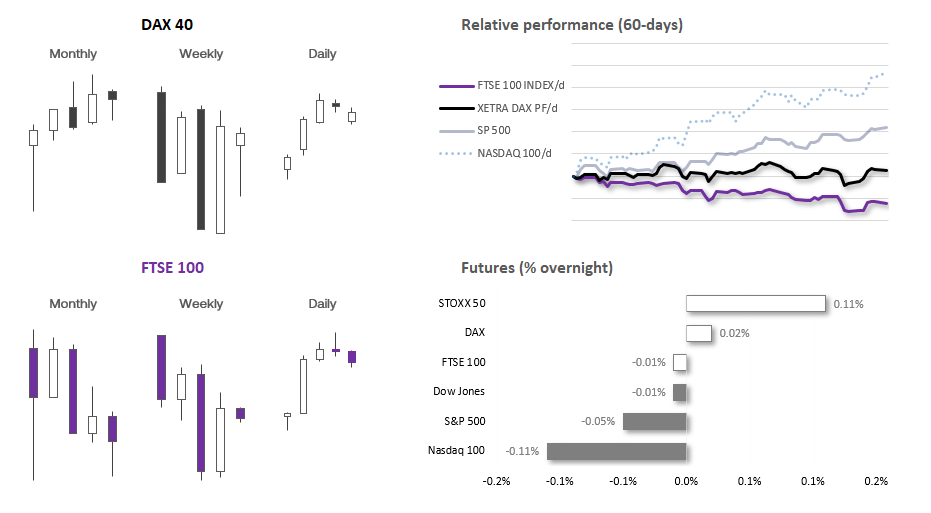
- UK's FTSE 100 futures are currently down -0.5 points (-0.01%), the cash market is currently estimated to open at 7,405.92
- Euro STOXX 50 futures are currently up 5 points (0.11%), the cash market is currently estimated to open at 4,361.79
- Germany's DAX futures are currently up 4 points (0.02%), the cash market is currently estimated to open at 16,072.65
US Futures:
- DJI futures are currently down -8 points (-0.02%)
- S&P 500 futures are currently down -2.75 points (-0.06%)
- Nasdaq 100 futures are currently down -19.75 points (-0.12%)
The RBA released their July monetary policy minutes which seemed to be a little more hawkish than some expected, given AUD rose to the occasion and the ASX 200 pulled back to a 2-day low. But even taking those moves into account, volatility has been very low and getting to levels we are usually accustomed to this time of year. Overnight ranges for FX majors are all below 50% of their 200-day averages and implied volatility for FX majors are between 56% - 82% of their 20-day MA’s which suggests we could be in for a slightly less exciting session. Unless we see some surprise numbers for US retail sales and Canada’s CPI data at 13:30 BST today.
As thing currently stand, the Fed are expected to hike in July but may need more convincing that there’ll be another hike in August. And whilst markets currently favour another 25bp hike for the BOC, they do not meet again until September which leaves a lot more room for the BOC to change their mind one way or another. And today’s CPI report for Canada could certainly move the dial for CAD traders if it comes in soft (or got) enough. US retail sales are expected to rise 0.5% m/m from 0.3% previously, and core retail sales is expected to rise to 0.3% from 0.1%. The BOC’s preferred inflation gauges are the Trimmed Mean and Median reads, with trimmed expected to soften to the relatively high level of 5% y/y (5.1% prior) and median at 3.7% (3.9% prior).

- USD/JPY is beneath yesterday’s doji close after failing to retest 139 earlier in the Asian session. A weak set of retail figures could potentially see USD/JPY head for Thursday’s low.
- USD/CHF is considering a break of Thursday’s multi-year low, but bears could be wise to wait to see if prices hold lower before assuming any breakout is legitimate at thee extended levels
- GBP/USD is turning higher and teasing bulls with a breakout of a continuation pattern on the 4-hour chart. Like all USD pairs we’d prefer to remain nimble given how stretched some of the moves have become. But, until we see bearish momentum return for the US dollar, the trends are assumed to hold.
- WTI crude oil is retracing slightly higher from yesterday’s lows, but we’re still looking for a potential break below $74 as outlined in an earlier tweet
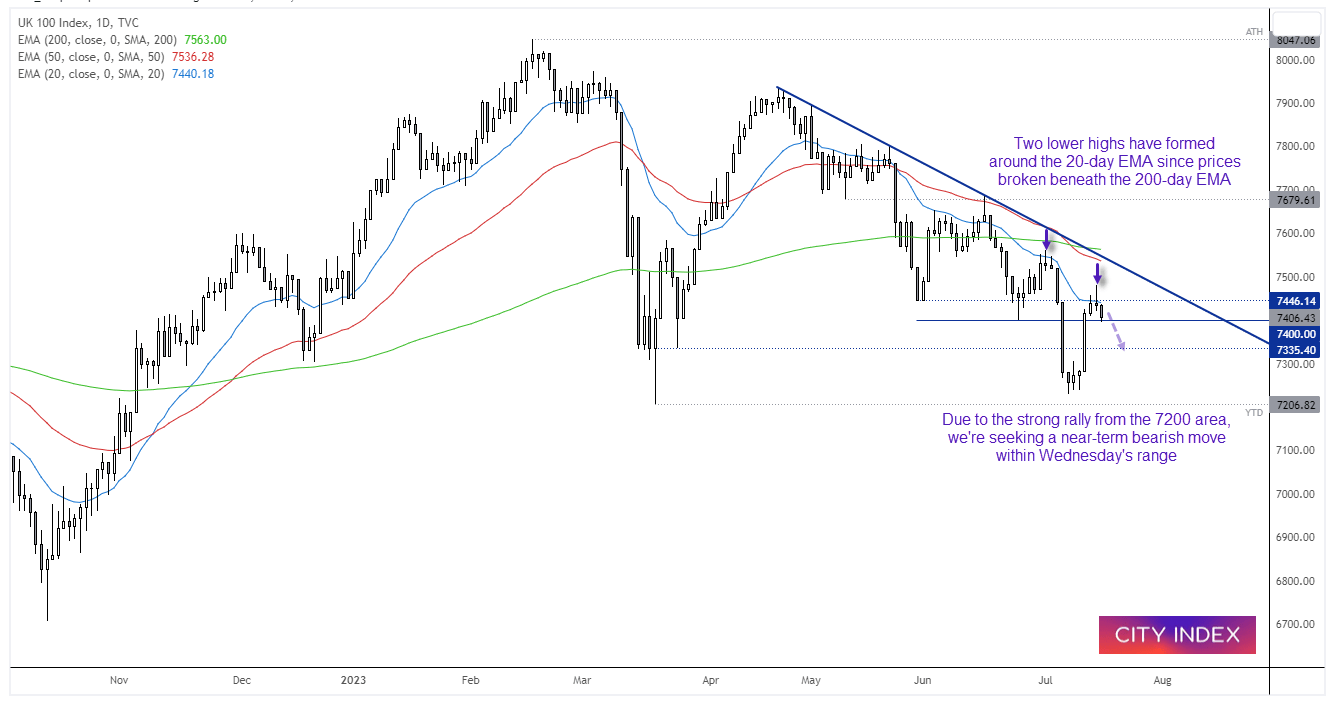
FTSE 100 daily chart:
The FTSE posted some solid gains on Wednesday on the relief of a softer set of US inflation data. Perhaps it means we have seen a significant low just above 7200, and the market could eventually to on to test trend resistance or the 200-day EMA around 7570. Yet Friday’s bearish pinbar closed back beneath the 7446 low and 20-day EMA to warn of a near-term top (if not a significant swing high ahead of a break below 7200), and yesterday’s prices broke lower to find support back at 7400.
Given the potentially for lower volatility, we’d prefer to remain nimble and seek closer target. But we’re now seeking a break beneath 7400 for a run towards the 7353.40 low. If a spell of risk-off arrives, we can reconsider its potential to run for (and break beneath) 7200.
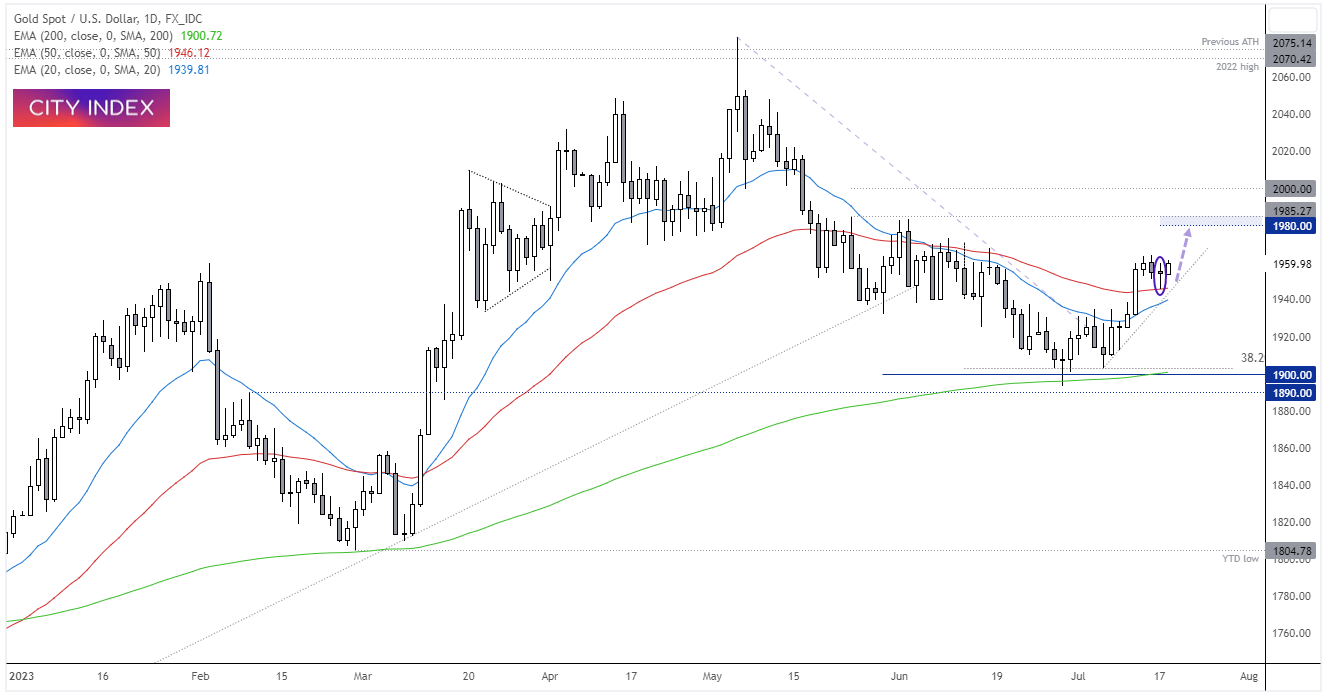
Gold 4-hour chart
Gold pulled back into the 1940 – 1950 liquidity gap we highlighted in yesterday’s Asian Open report, found support at the 50-day EMA and formed a Doji on the daily chart. Perhaps we have seen a swing low after a brief consolidation near its cycle highs, but we’re also aware that gold has the ability to provide price spikes in the opposing direction it intends to eventually travel. Therefore, bulls could seek dips above 1940, the 50-day EMA or trend support with the initial target being 1980 (just beneath the May high’s). A break beneath Wednesday’s low assumes a return to 1900.
View the full economic calendar
-- Written by Matt Simpson
Follow Matt on Twitter @cLeverEdge
How to trade with City Index
You can trade with City Index by following these four easy steps:
-
Open an account, or log in if you’re already a customer
• Open an account in the UK
• Open an account in Australia
• Open an account in Singapore
- Search for the market you want to trade in our award-winning platform
- Choose your position and size, and your stop and limit levels
- Place the trade
Latest market news
Yesterday 01:32 PM
Yesterday 09:35 AM
Yesterday 07:23 AM
Yesterday 04:48 AM
Yesterday 12:17 AM
July 25, 2024 10:39 PM
Latest Trade Ideas articles

Yesterday 09:35 AM

Yesterday 12:17 AM

July 25, 2024 10:39 PM

July 25, 2024 05:30 PM