


Euro, EUR/USD, EUR/JPY Talking Points:
- It’s a big week for the Euro and EUR/USD as Wednesday brings CPI out of the United States and Thursday brings the European Central Bank’s rate decision. And then the following week brings the FOMC rate decision, which should keep EUR/USD as a focal point for the next couple of weeks.
- EUR/JPY has been in the midst of a strong breakout for more than a year but recently, that move has begun to stall at a long-term area of interest, just inside of the 160 handle. With hints of possible change around Japanese monetary policy there could be some interesting scenarios to entertain in the EUR/JPY pair.
- I’ll be discussing these themes in-depth in the weekly webinar on Tuesday at 1PM ET. It’s free for all to register: Click here to register.
It’s been eight consecutive weeks of losses for EUR/USD, and this is somewhat rare as it’s only happened one other time in the EUR/USD pair over the past ten years. That prior instance was just about ten years ago as the Euro was in a massive sell-off against most major currencies, the US Dollar included.
That instance in 2014 showed up just ahead of a massive move in the pair that drove through the 2015 open, which highlights a point of interest. EUR/USD is often considered to be the largest and most liquid currency pair given that it represents the two largest economies in the world. To see a move of that consistency highlights that we may be seeing something important getting priced-in, such as what happened in 2014.
And in a related matter, the US Dollar has just completed its eighth consecutive weekly gain which similarly hasn’t happened in a decade. I had discussed the nuance around that in the USD in late-August and since then the Dollar has continued that bullish run, with two more green weekly candles to put the running tally to eight, which would be the most in DXY since September of 2014.
On the below weekly chart of EUR/USD, I’ve outlined that prior instance to illustrate what happened after the eight consecutive weekly loss. This is, of course, a single anecdote, but it does illustrate how such decisive theme in a major market like EUR/USD may be telling us something notable.
EUR/USD Weekly Chart
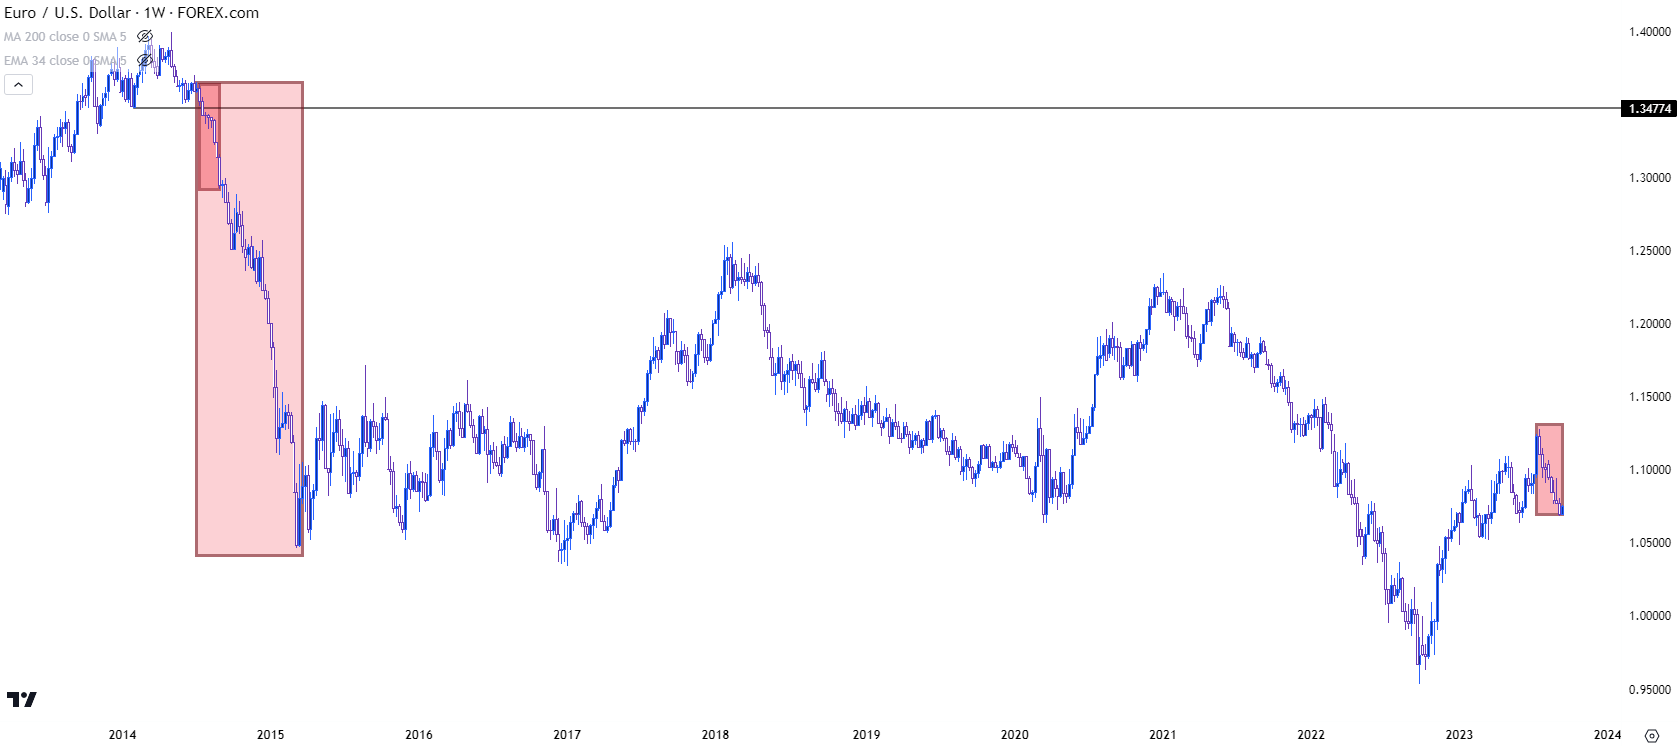 Chart prepared by James Stanley, EUR/USD on Tradingview
EUR/USD Intermediate-Term
Taking a closer look at near-term dynamics in the pair and we can see a couple of different prior trends at work. For much of the first nine months of last year, sellers continued the bearish trend that ran loudly through 2021 trade. But it was around September and October of last year, when the ECB picked up rate hikes in 75 bp increments that the trend began to go into reverse, and this made a loud statement in Q4 of last year and extended through January trade.
But it was in February that matters began to shift, as the pair failed to hold a move above the 1.1000 level and this was around the time that US data was coming in with a bit more strength, headline by a massive NFP print in early-February.
The bearish push through February soon met support in March, and this was around the time that the regional banking crisis in the US prodded a push of USD-weakness, driven by the hope or prospect that the Fed might refrain from additional hikes for fear of collateral damage to the banking sector. And while we did get a pause in June, the Fed came back to hike again in July and with economic data holding somewhat strong in many areas of the economy, the door remains open for another hike.
In EUR/USD, after that bounce in March, price has been showing consolidation. In July, we saw a key level come into play at 1.1275 which is the 61.8% Fibonacci retracement of the 2021-2022 major move.
Since then, there hasn’t been a single green weekly candlestick to print. There was an attempt from bulls to hold support at the 50% marker of that same major move, plotted at 1.0943. But that’s failed, and two weeks ago price even showed a weekly high at that level, illustrating resistance at prior support that keeps the door open for sellers.
EUR/USD Weekly Price Chart
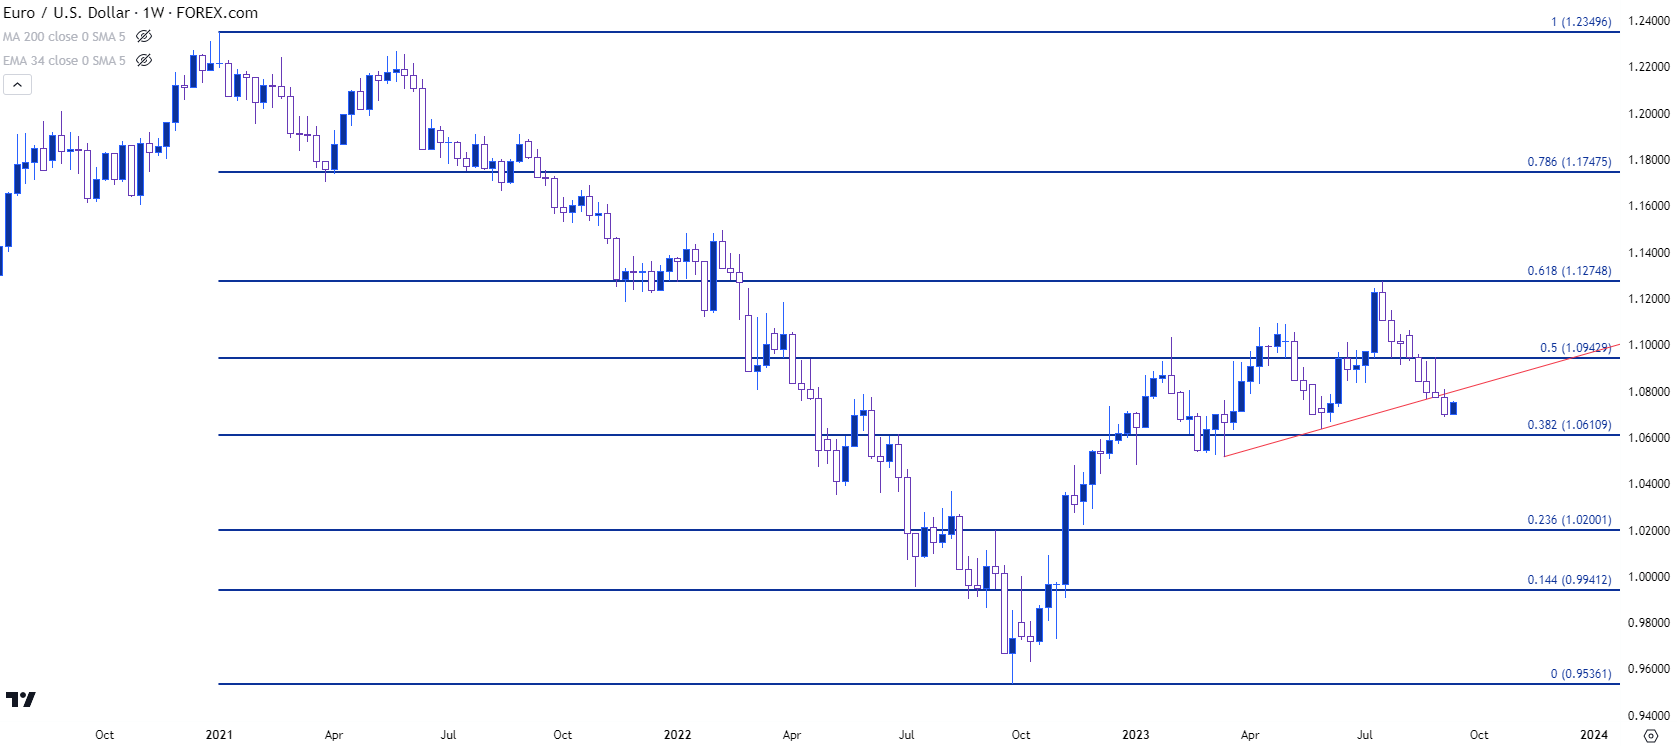 Chart prepared by James Stanley, EUR/USD on Tradingview
EUR/USD Shorter-Term
Going down even lower on timeframes and we can get better vision on that recent sell-off. Support is currently holding at 1.0690, which was a level that I had discussed in last week’s webinar, and price has since moved up to another level that I’ve been talking up at 1.0760, which was a prior spot of resistance-turned-support that’s now back in the picture as resistance.
This may be a lower-high, although sellers would need to react quickly. Just above this level is another potential resistance level at 1.0843.
EUR/USD Four-Hour Price Chart
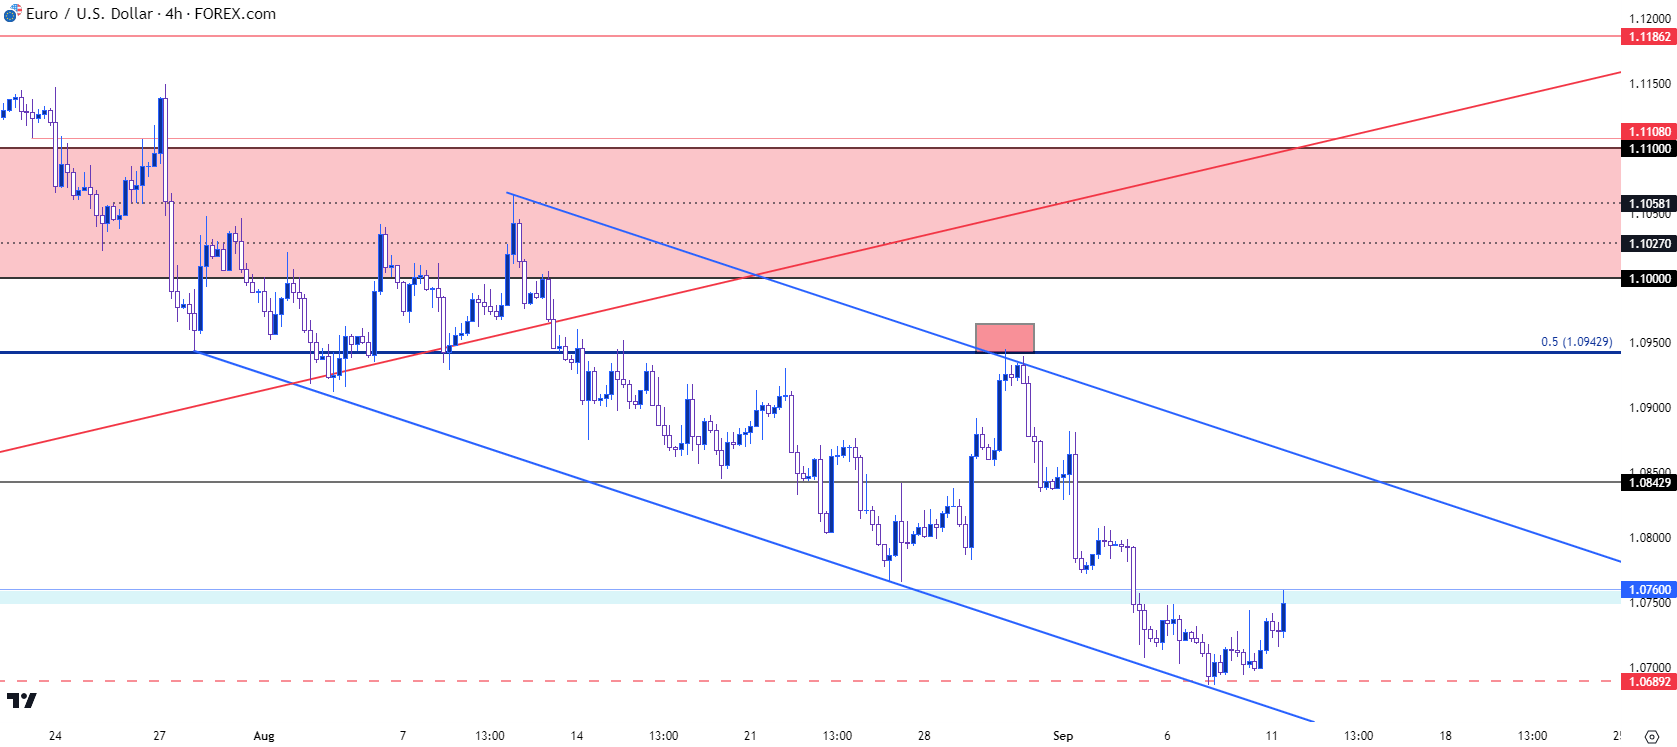 Chart prepared by James Stanley, EUR/USD on Tradingview
EUR/JPY Bullish Breakout Begins to Stall at Major Level
In a related matter the bullish trend in the Euro against the Japanese Yen has finally started to slow. The same weakness that’s helping to push EUR/USD bearish themes has begun to offset the weakness from the Japanese Yen.
And with the past week bringing a couple of possible threats to that theme of Yen-weakness, with last week’s allusions to intervention combining with this early week’s mention of possible rate hikes out of Japan, there could be building potential for a pullback move.
In EUR/JPY, I’m looking at the monthly chart below to highlight that current resistance roots from a gap in the pair from back in 2008. This gap showed between the August close and the September open, and while it did fill, it remained on the chart like a beacon for 15 years until price could finally scale up for a re-test in June of this year.
Since then, bulls have been largely spinning their wheels.
EUR/JPY Monthly Price Chart
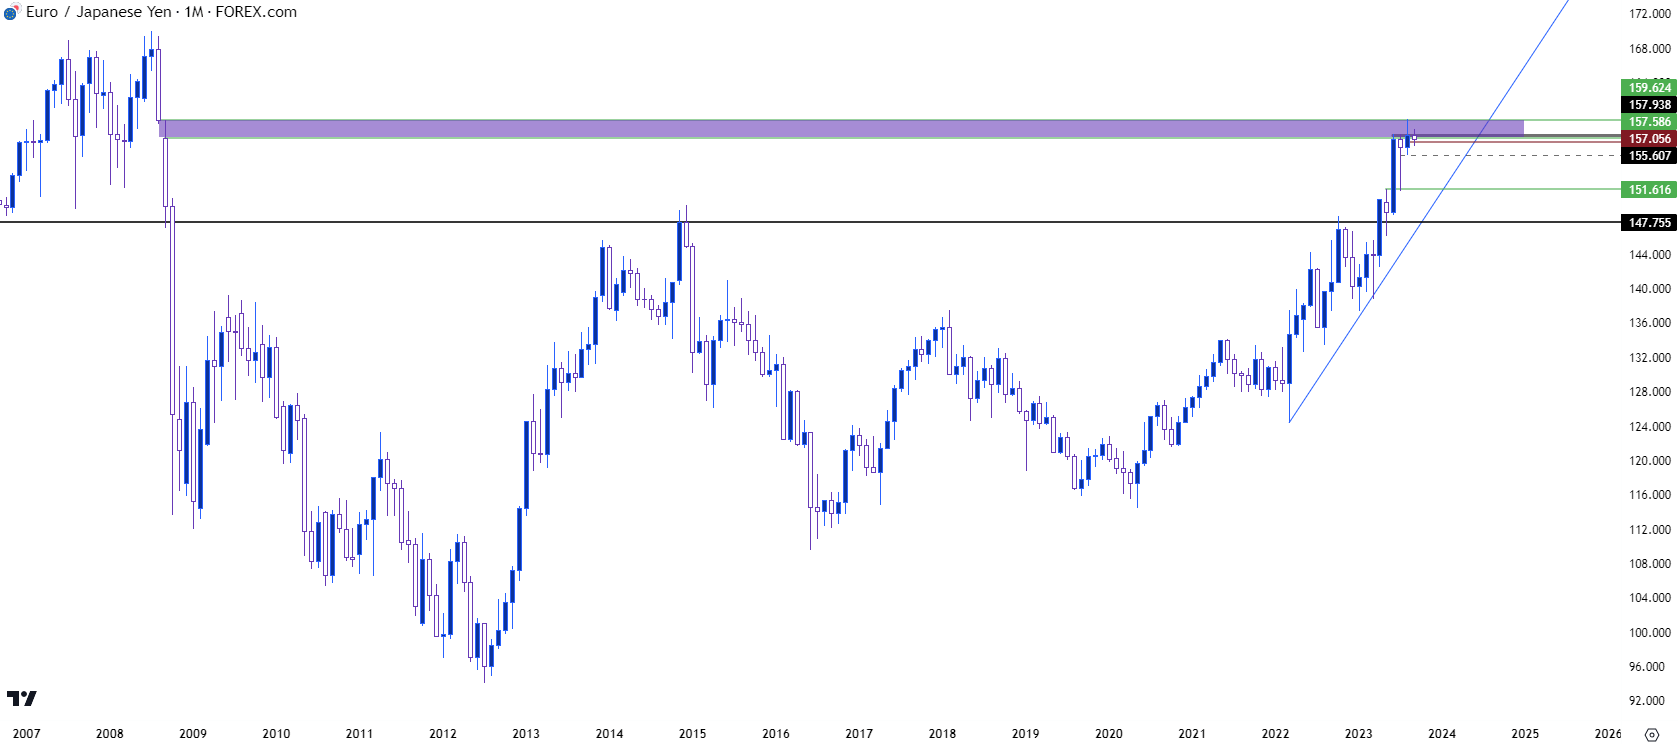 Chart prepared by James Stanley, EUR/JPY on Tradingview
EUR/JPY Weekly
From the weekly chart, we can get great detail on this recent resistance test. The first re-test of this zone was on June 27th and for the past two and half months buyers have largely been spinning their wheels.
There has been some recent change, however, as the four weekly bars leading into last week had all shown higher highs. Last week was the first instance of break in that sequence with a lower-high posting, and that gives a bit of reference for pullback plays.
This week has begun with a test of a lower-low and if sellers can hold resistance below last week’s high, there may be a building case for reversal potential in the pair.
On the driver side of the matter, there’s the ECB rate decision on Thursday to contend with, and this could set up for an interesting reversal scenario, as well. If we do see the ECB hike, there could be motive for bulls to push above resistance, and the 160 psychological level is just above the current zone. If no bulls show up to support the move above 160, that could set the stage for false breakout potential that could feed into reversals.
EUR/JPY Weekly Price Chart
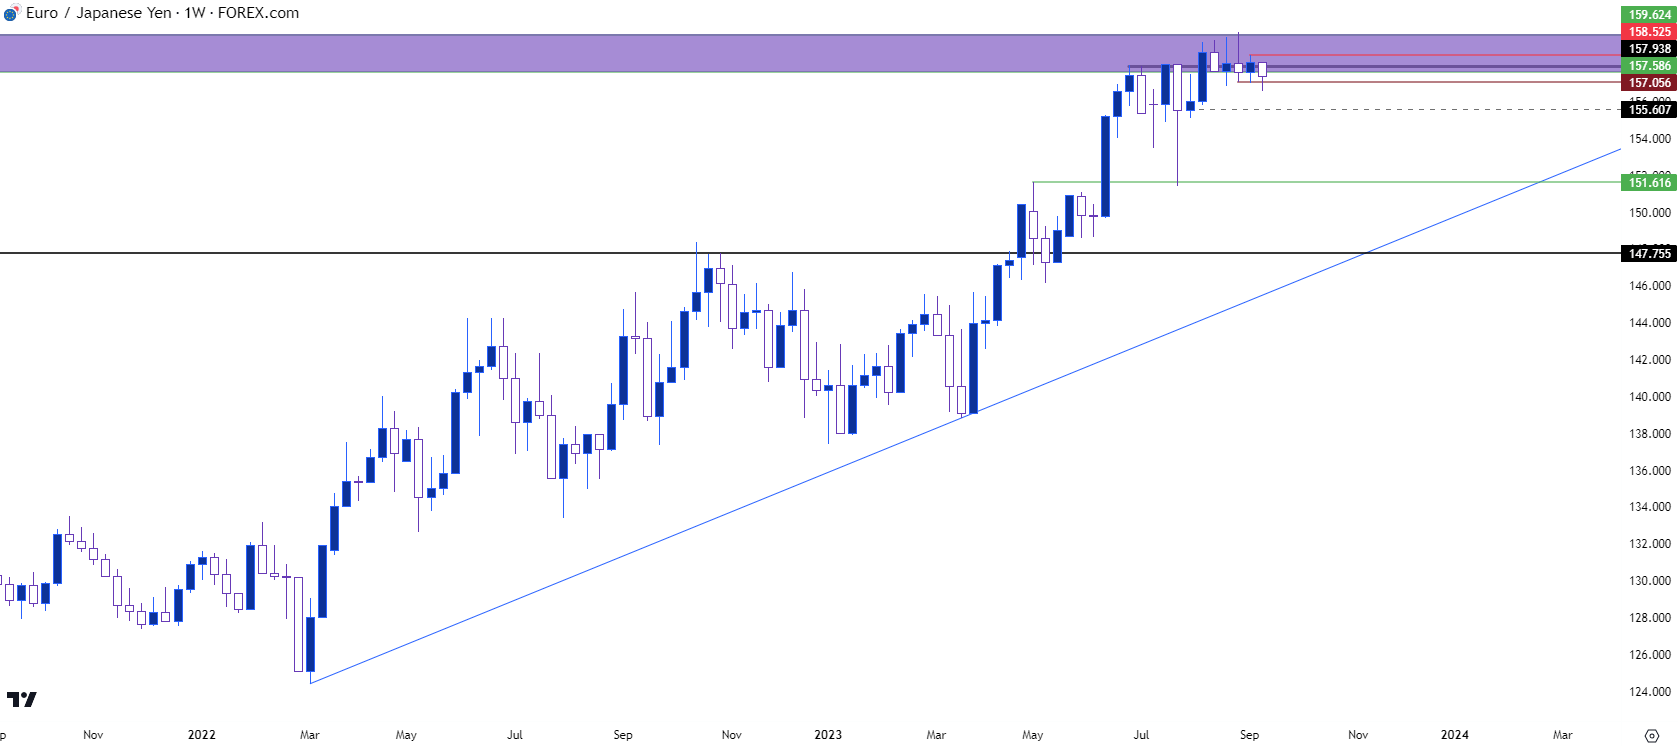 Chart prepared by James Stanley, EUR/JPY on Tradingview
EUR/JPY Daily Structure
Going down to the daily chart highlights this recent bullish structure along with the test of a fresh lower-low to start this week. The move didn’t stick, and prices have pulled back, but the fact that bears were willing to test a new low may be an important early item to track. That, combined with a lower-high, is setting the stage for a possible introduction of bearish structure but we’re still at the very early stages of that theme.
Above current price, the 157.93 level presents resistance potential, and then 158.55 highlights the next resistance level on the chart. If bulls can break above that, then the lower-high from last week would be nullified and this would put focus on the top-end of that zone, plotted around 159.62. And above that the 160 looms large.
Given the recent saber-rattling out of Japan combined with European economic data, it can be difficult to imagine a prolonged move developing above that 160 spot. So, if we do get a breakout, tracking higher-low support after the initial 160 test would be a key to follow for tracking trends in that market.
EUR/JPY Daily Price Chart
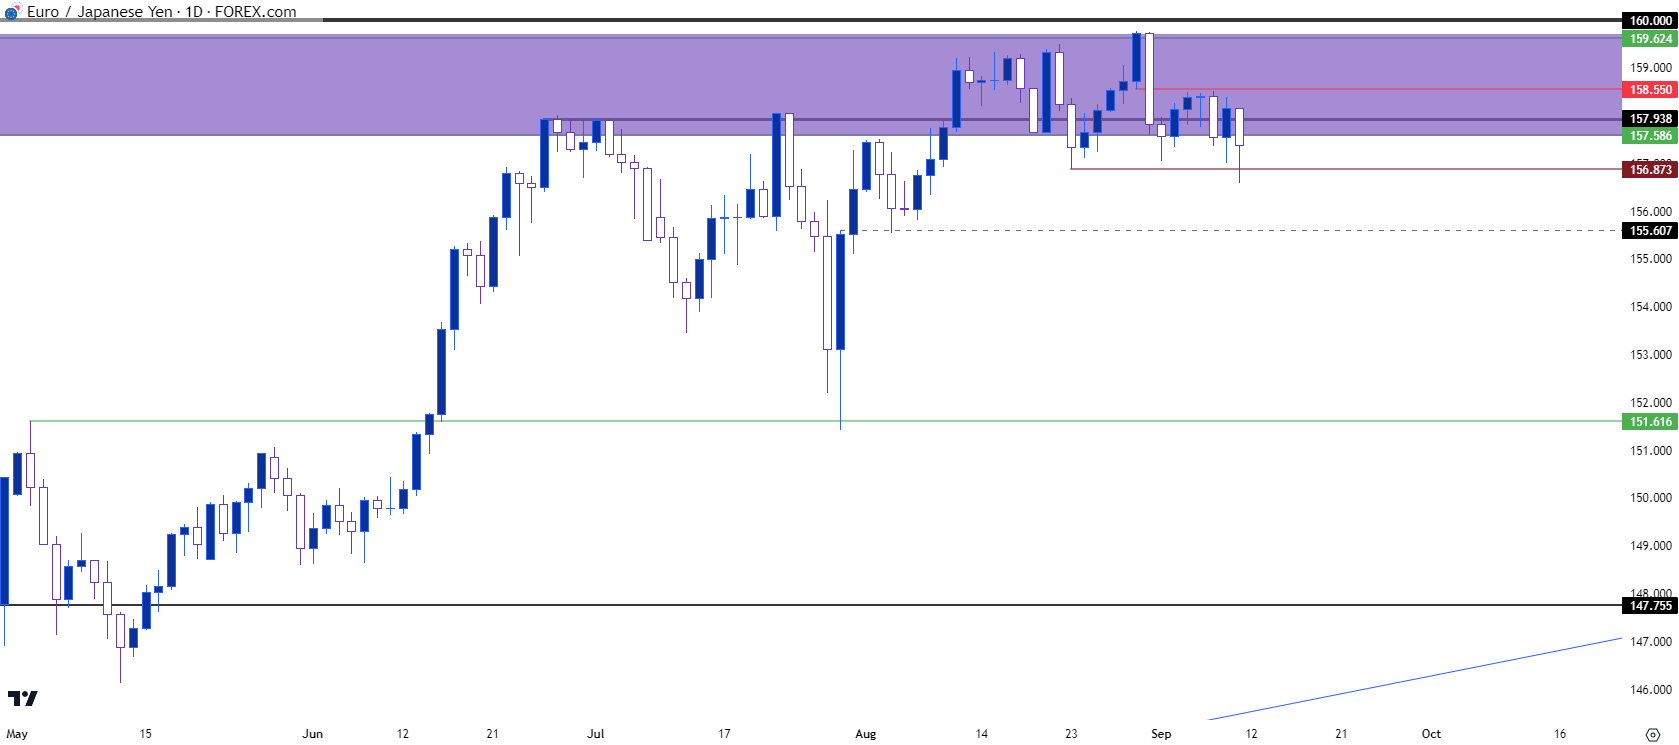 Chart prepared by James Stanley, EUR/JPY on Tradingview
--- written by James Stanley, Senior Strategist
Latest market news
Yesterday 11:57 PM
Yesterday 08:00 PM
Yesterday 02:00 PM
Yesterday 08:00 AM
Latest Trade Ideas and Alerts articles

April 16, 2024 04:24 AM

April 15, 2024 06:08 AM

December 14, 2023 06:06 PM

December 6, 2023 12:10 PM