


Like the vast majority of indices, the Dax has generally performed well in December. Looking back through data since 1987, the DAX has closed higher 71.4% of the time with an average positive return of 2.2%. I’s best streak was to post gains in December for eight consecutive years between 2003 to 2010, although this relationship seems to have faltered in recent years, with three of the past six December posting a loss.
The DAX reached a record high this month and seems on track to close December as another positive month, but will it have enough juice in its tank to rally into the year end? Given we have seen prices retrace from its record high ye6 hold above support, I suspect it can.
Dax seasonality by month
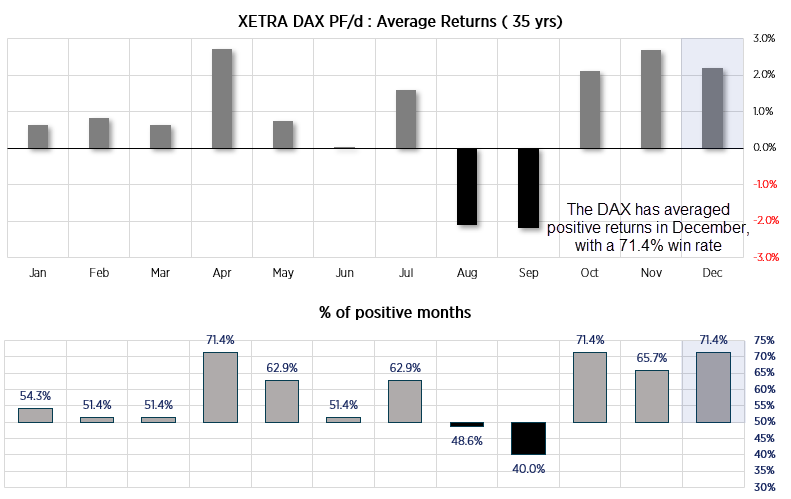
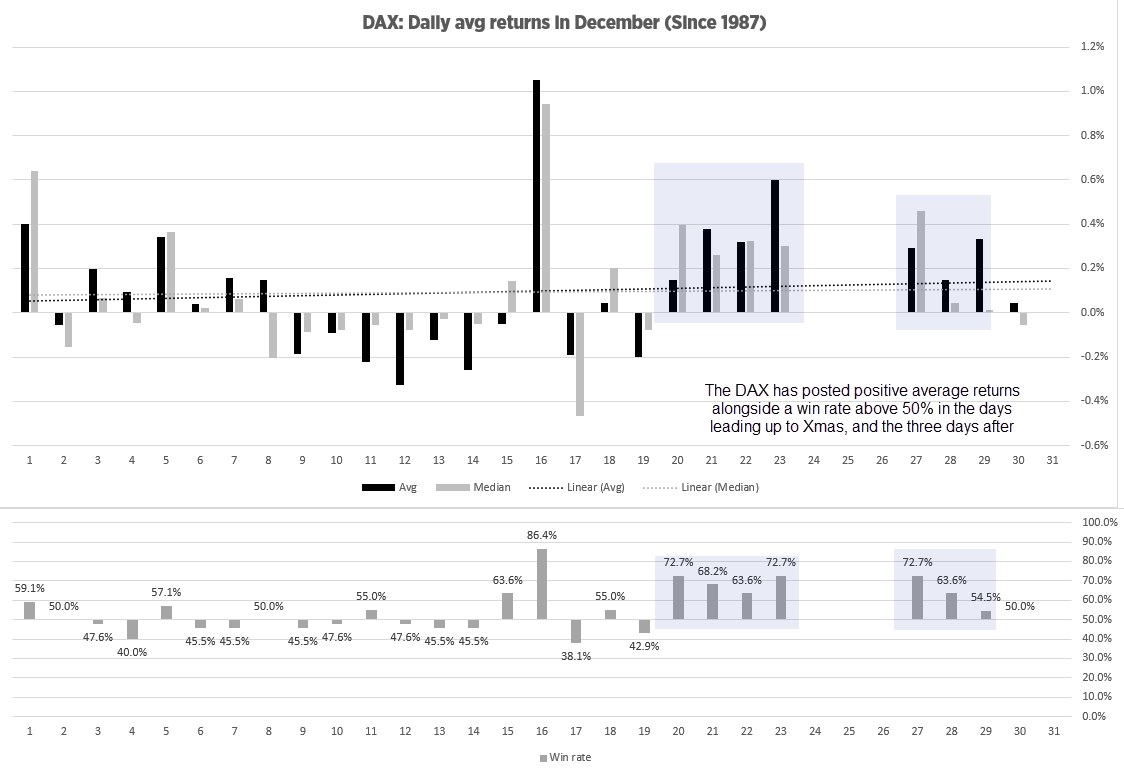
Dax seasonality in December
The following chart shows average and median returns for the Dax by calendar day, using daily data since 1987. The win rate is also displayed below, as what I like to see is the combination of positive returns alongside a positive win rate. It is interesting to note that the DAX has delivered positive average and median returns alongside a positive win rate on the 20th through to the 23rd of December, and on the three days it has opened after Christmas ahead of the New Year. Also note that the 19th (today) has posted negative median and average returns alongside a lose rate of 57.1%.
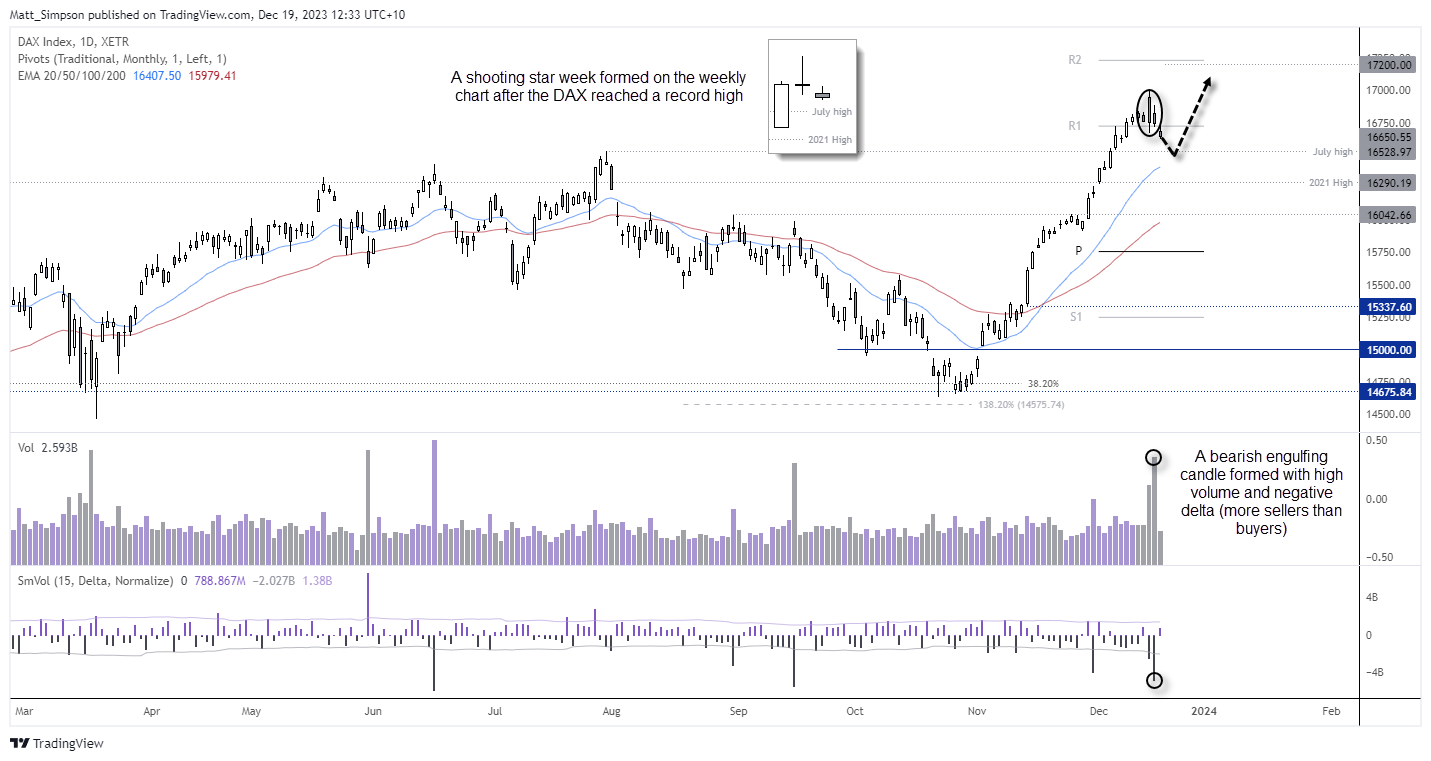
Dax technical analysis (daily chart):
If the Dax is to follow it’s seasonal pattern from here, we could assume a down day today and look for evidence of a swing low after the close. The previous record high (now the July high) is one area to look for potential support, ahead of an anticipated rally into Christmas and the three working days after Christmas, ahead of the new year.
Note that a shooting star reversal formed on the weekly chart after it reached a record high. A bearish engulfing day formed on high volume and negative delta (more sellers than buyers) to show bears loaded up at these highs. So if prices fail to drop materially from here, bears may be forced to cover and help generate a rally.
Traders should be aware that seasonal analysis really does just look at average historic performance and is not simply a roadmap for future directional prices. But it can be used to complement one’s own research.
-- Written by Matt Simpson
Follow Matt on Twitter @cLeverEdge
How to trade with City Index
You can trade with City Index by following these four easy steps:
-
Open an account, or log in if you’re already a customer
• Open an account in the UK
• Open an account in Australia
• Open an account in Singapore
- Search for the market you want to trade in our award-winning platform
- Choose your position and size, and your stop and limit levels
- Place the trade
Latest market news
Yesterday 01:32 PM
Yesterday 09:35 AM
Yesterday 07:23 AM
Yesterday 04:48 AM
Yesterday 12:17 AM
July 25, 2024 10:39 PM
Latest Trade Ideas articles

Yesterday 09:35 AM

Yesterday 12:17 AM

July 25, 2024 10:39 PM

July 25, 2024 05:30 PM