


July 15, 2021 1:20 AM
Bank of Canada tapers; Sell the rumor, buy the fact for USD/CAD
The Bank of Canada left rates unchanged at 0.25% and reduced asset purchases from 3 billion Canadian Dollars per week to 2 billion Canadian Dollars per week, As we discussed in our BOC Preview, results were as expected. However, although the central bank tapered, they do not expect to hike rates anytime before the 2nd half of 2022. Bank of Canada Governor Tiff Macklem said that the adjustment reflects the continued progress towards recovery and the Bank’s increased confidence in the strength of the economic outlook. The BOC slightly downgraded 2021 GDP to 6%, however revised its 2022 and 2023 forecasts higher, at 4.5% and 3.25% respectively. In addition, they expect inflation to remain above 3% for the rest of this year and fall back towards 2% next year.
Everything you need to know about the Bank of Canada
USD/CAD had been coiling with a symmetrical triangle for the last week as the Bank of Canada meeting approached. However, when North American woke up this morning, they sold USD/CAD into the release of the meeting statement, down to a low of 1.2425 and piercing the bottom trendline of the triangle. After the “as expected” release, the pair moved higher, back to pre-selloff levels near the downward sloping trendline of the triangle near 1.2525.
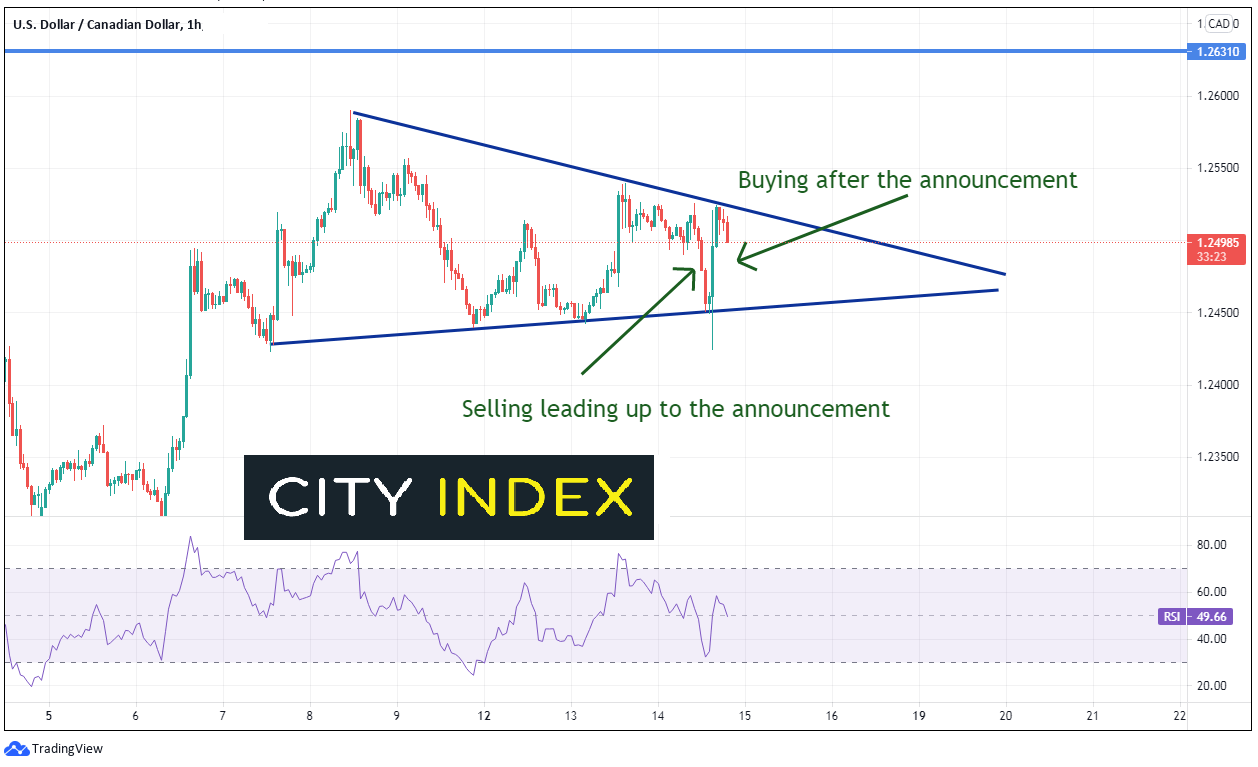
Source: Tradingview, City Index
However, also as noted in the BOC preview, the USD/CAD move may be more of a reflection of the move in the US Dollar than of a move in the Canadian Dollar. As price held resistance today on the bounce in USD/CAD, DXY moved lower on the statement release of US Fed Chairman Powell’s written statement that substantial further progress is still a ways off. Markets took this to mean that tapering won’t happen anytime soon. On a 60-minute timeframe, the DXY has paused on its way lower and appears to be forming a falling triangle. The target for this formation is the height of the pattern added to the breakdown point. Therefore, if DXY breaks below 92.37, price could be on its way towards the target, just below horizontal support at 92.00.
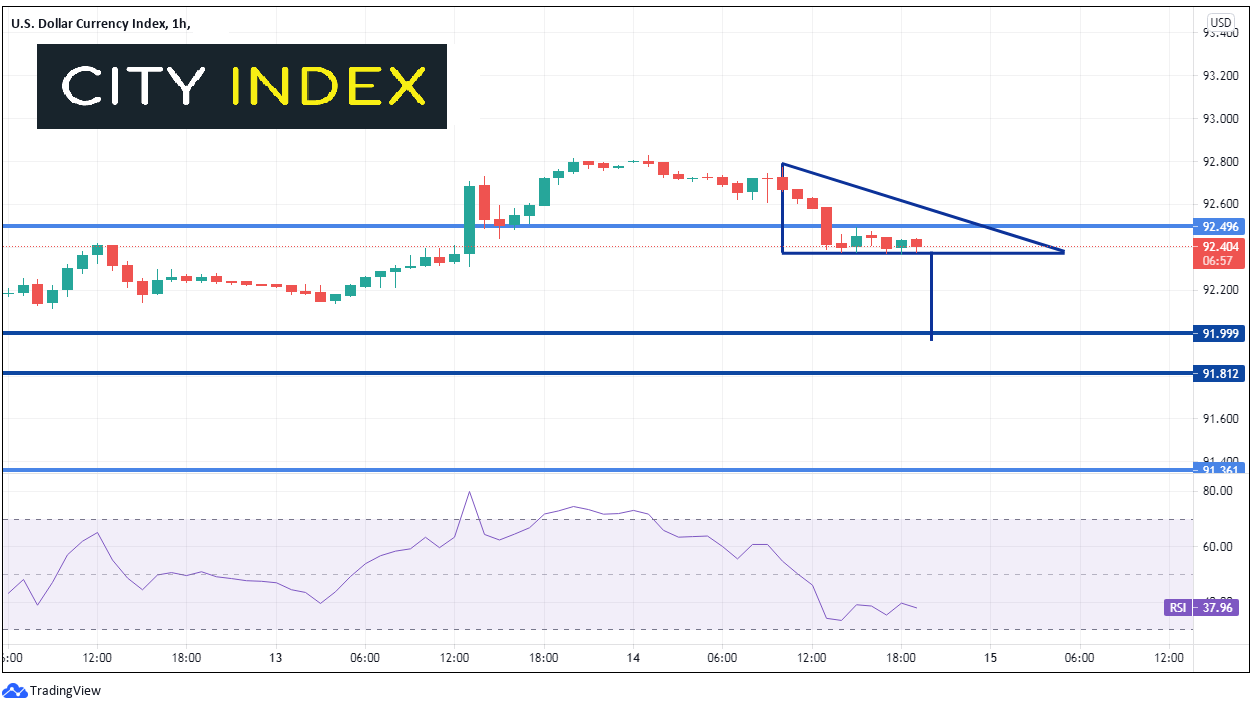
Source: Tradingview, City Index
Everything you need to know about the Federal Reserve
What does that mean for USD/CAD? It possibly means that the high is in, for the short-term, at the top of the symmetrical triangle and that price could trade back in the range. The bottom trendline of the triangle crosses near 1.2450. Below there, price can fall to horizontal support near 1.2366. Resistance is just above at the top trendline of the triangle near 1.2525 and then the highs of July 8th near 1.2590.
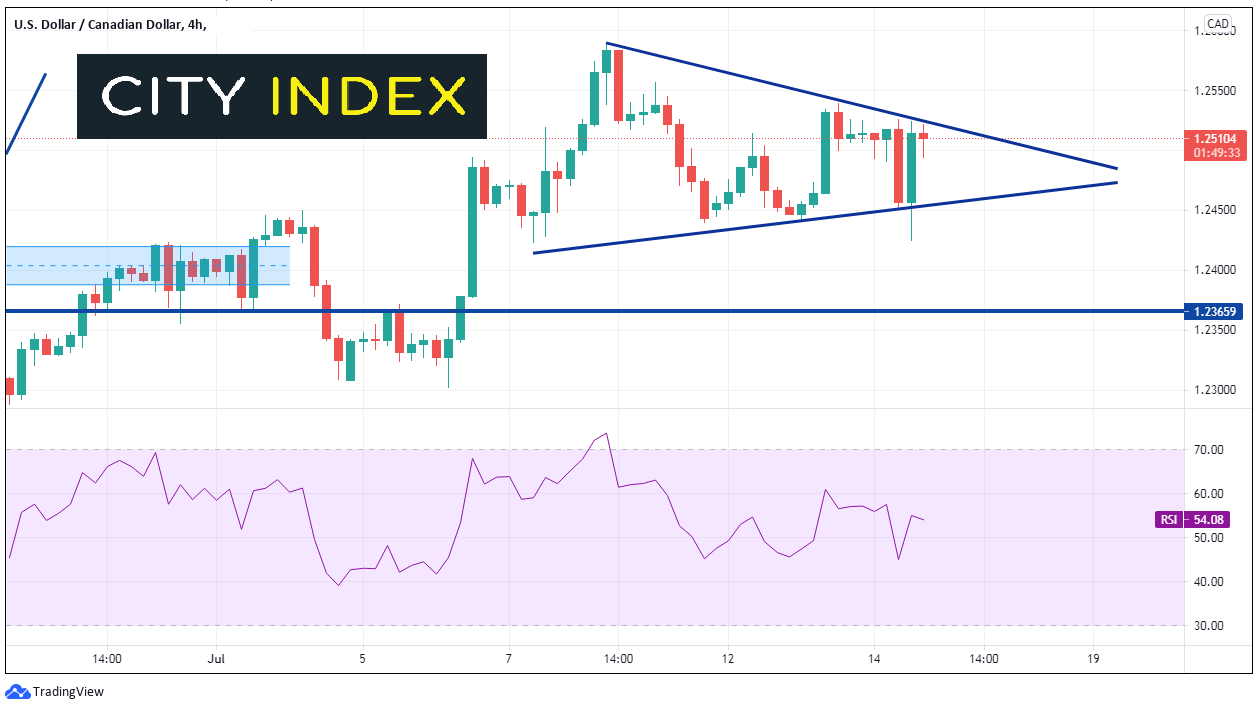
Source: Tradingview, City Index
Tomorrow, Canada releases ADP Employment Change and the US releases the Philadelphia Fed Manufacturing Index. OPEC may also release an agreement regarding supply output of oil. All of these could affect the movement of USD/CAD. Traders need to be aware of any data that may sway the BOC from its hawkish path and/or cause the Fed to begin leaning less dovish.
Learn more about forex trading opportunities.
Latest market news
Yesterday 01:32 PM
Yesterday 09:35 AM
Yesterday 07:23 AM
Yesterday 04:48 AM
Yesterday 12:17 AM
July 25, 2024 10:39 PM
Latest Forex articles

Yesterday 12:17 AM

July 25, 2024 10:39 PM

July 25, 2024 03:59 PM

July 25, 2024 04:37 AM