


Thursday US cash market close:
- The Dow Jones Industrial fell -129.64 points (-0.38%) to close at 34,168.09
- The S&P 500 index fell -23.42 points (-0.54%) to close at 4,326.51
- The Nasdaq 100 index fell -169.648 points (-1.2%) to close at 14,003.11
Asian futures:
- Australia's ASX 200 futures are up 101 points (1.51%), the cash market is currently estimated to open at 6,939.30
- Japan's Nikkei 225 futures are up 330 points (1.26%), the cash market is currently estimated to open at 26,500.30
- Hong Kong's Hang Seng futures are up 34 points (0.14%), the cash market is currently estimated to open at 23,841.00
- China's A50 Index futures are down -9 points (-0.06%), the cash market is currently estimated to open at 15,015.56
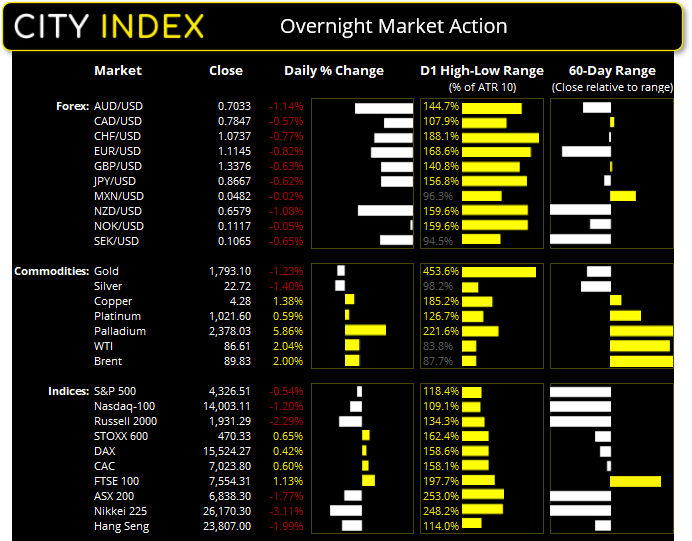
Red remained the colour of the day yesterday, with Asian, European and US indices extending their post-FOMC losses. It seems equity traders are finally taking the Fed hike seriously and factoring in the prospects of squeezed profit margins as their debt payments are about to become more expensive. The Russell 2000 (small caps) fell -2.3% and the Nasdaq fell a further -1.2%. Despite this, futures markets across Asia point towards a higher open today, at which point we will find out whether a reversal is underway or bears simply stap back in at higher prices.
ASX200 – Remember, volatility cuts both ways
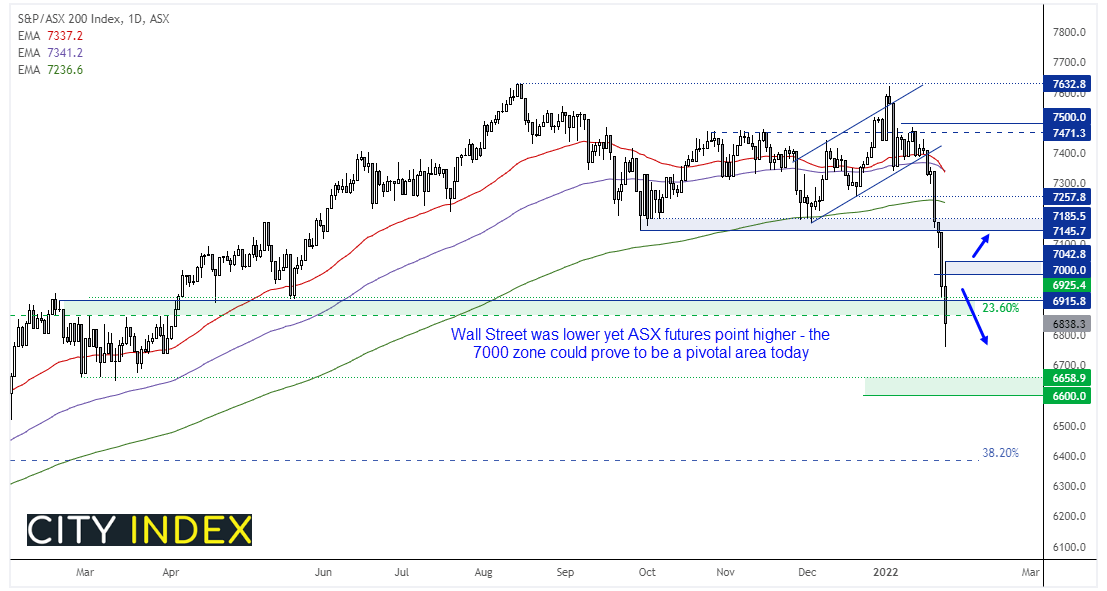
You’d think that the lead from Wall Street doesn’t bode well for the ASX 200 today, yet futures markets are pointing to a gap higher. And, at the same time, its move lower does look over-extended. And bears late to the picnic would be wise to remember that volatility cuts both ways, especially during such bearish moves where prices can easily whipsaw against bears, despite a negative narrative. The ASX 200 is currently down around -11% from its year-to-day high, making it its worst month since March 2020 and 8% of those losses have occurred over the past four days. So whilst it could easily crash and burn today, we’re mindful that equities are not playing nicely at the moment so wider stops and lower levels of exposure are always an option.
ASX 200: 6838.3 (-1.77%), 26 January 2022
- Energy (2.11%) was the strongest sector and Information Technology (-4.95%) was the weakest
- 2 out of the 11 sectors closed higher
- 9 out of the 11 sectors closed lower
- 4 out of the 11 sectors outperformed the index
- 156.6 (76.92%) stocks advanced, 9 (4.42%) stocks declined
Outperformers:
- +8.81% - Beach Energy Ltd (BPT.AX)
- +4.45% - AusNet Services Ltd (AST.AX)
- +3.57% - Santos Ltd (STO.AX)
Underperformers:
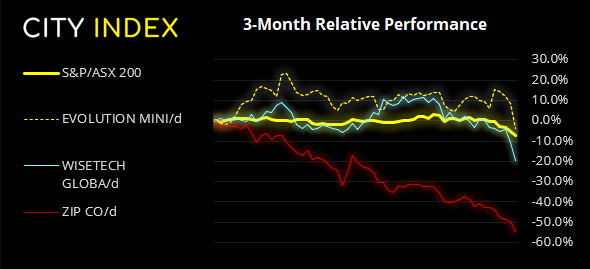
- -11.3% - Evolution Mining Ltd (EVN.AX)
- -9.85% - WiseTech Global Ltd (WTC.AX)
- -9.66% - Zip Co Ltd (Z1P.AX)
King dollar remains leader of the pack
The US dollar retained its grip on the currency markets and traded higher against all major currencies. The US dollar rose to an 18-month high during its most bullish session in 11-weeks, which saw EUR/USD close firmly below the 1.12 handle for the first time since June 2020. As things stand the euro is on track for its most bearish month in seven. USD/JPY closed above 115 in line with our bias from yesterday’s Asian open report and appears set to reclaim 116 near the YTD highs as it tracks US-JP yield differentials higher.
The Aussie and Kiwi were the weakest majors which saw AUD/USD fall to just 20 pips above 70c. It appears to be only a matter of time before the key level is challenged, which leaves the question as to which side of this milestone level it will close the week today.
Gold falls below 1800, silver selloff accelerates
The combination of a strong dollar and rising real rates forced the yellow metal back below 1800 during a second day of turbulent selling. Whilst we suspect gold will shine again, momentum is clearly pointing lower over the near-term as bears have their fun within a multi-month triangle formation. A downside break of the August trendline could shake things up but, for now at least, we suspect selling pressures could subside as we approach 1790.
Bearish momentum for silver accelerated during its worst session since September. It has closed lower for five consecutive days although support was found at 22.60 and trend support from the December low is also nearby.
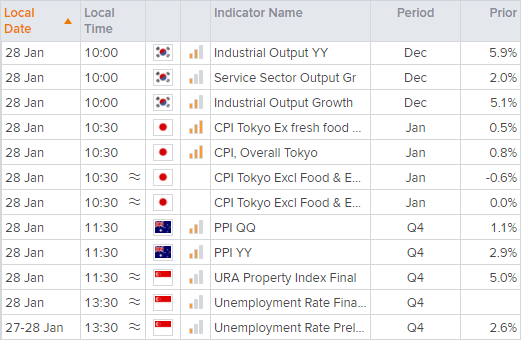
Up Next (Times in AEDT)
How to trade with City Index
You can easily trade with City Index by using these four easy steps:
-
Open an account, or log in if you’re already a customer
• Open an account in the UK
• Open an account in Australia
• Open an account in Singapore
- Search for the company you want to trade in our award-winning platform
- Choose your position and size, and your stop and limit levels
- Place the trade
Latest market news
Yesterday 01:32 PM
Yesterday 09:35 AM
Yesterday 07:23 AM
Yesterday 04:48 AM
Yesterday 12:17 AM
July 25, 2024 10:39 PM
Latest Trade Ideas articles

Yesterday 09:35 AM

Yesterday 12:17 AM

July 25, 2024 10:39 PM

July 25, 2024 05:30 PM