


May 11, 2022 4:05 AM

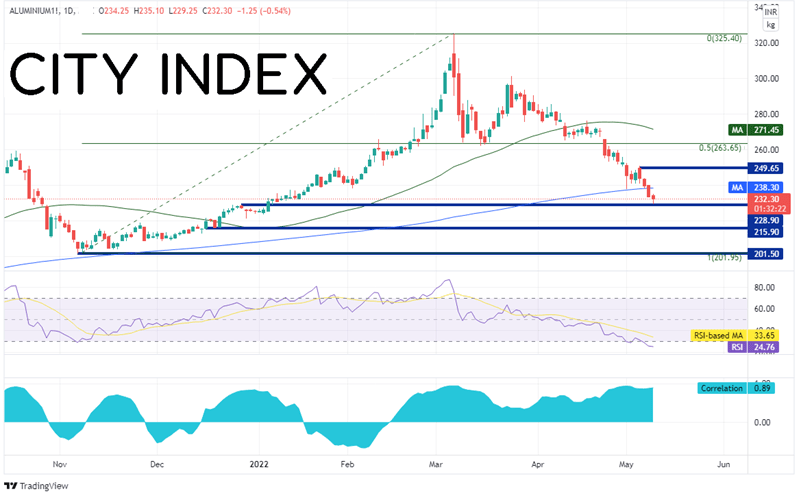
In early November 2021, Aluminum found support at the 200 Day Moving Average near 201.50. For the next 3 months, the industrial mental moved higher as inflation reared its ugly head. Price reached a high of 325.40 on March 7th, just as after Russia invaded Ukraine. Fears of a lack of demand began to trickle through the market as price pulled back to the 50% retracement level from the low of November 8th, 2021 to the March 7th high. Just as Aluminum tried to bounce again, lockdowns due to coronavirus in China became more abundant. More specifically, the lockdown in Shanghai increased fears once again that a slowdown may be ahead. On March 24th, the metal traded at 301.4. Today it trades near 232.0, as yesterday, it had traded below the 200 Day Moving Average at 238.30. Will it continue to move lower? Aluminum is currently sitting just above horizontal support at 228.90. Additional horizontal support is below at 215.90, then a full retracement to the November 8th, 2021 lows at 201.50. However, notice the RSI is in oversold territory, an indication that Aluminum may be ready to bounce. Resistance is just above at the 200 Day Moving Average and then the highs from May 5th at 250.65
Source: Tradingview, Stone X
Notice the correlation coefficient between Aluminum and AUD/USD in the bottom panel of the chart. The correlation coefficient is +0.89. Readings above +0.80 are considered to be strong correlations. Therefore, given the current correlation, if Aluminum continues to move lower, AUD/USD could continue to move lower as well.
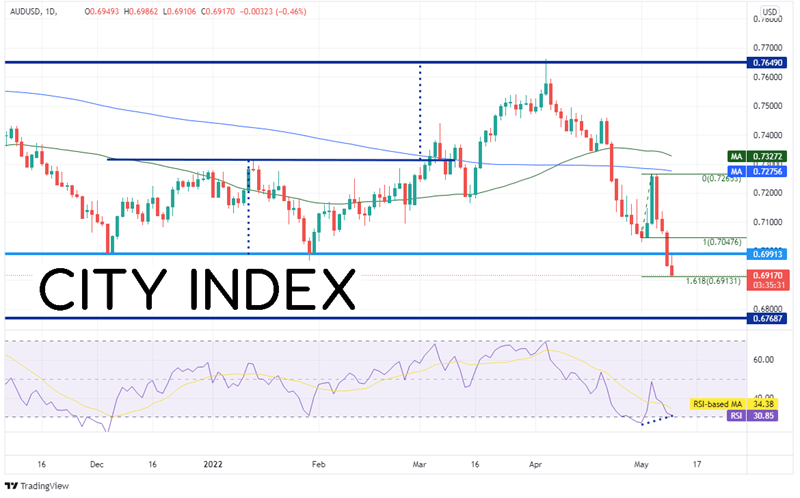
AUD/USD formed a double bottom in late 2021 and early 2022 and began moving higher. The target for the double bottom pattern is the height of the pattern added to the breakout point, which is this case was near resistance from June 2021 at 0.7650. AUD/USD reached the target on April 5th as price formed a shooting start candlestick and began moving lower. Since then, AUD/USD has continued to move lower and hasn’t looked back. Yesterday, AUD/USD broke though the floor of the double bottom near 0.6990 and is continuing to move lower today. Support is near today’s low and the 161.8% Fibonacci extension from the low of May 2nd to the highs of May 4th, near 0.6913. Below there, price can fall to support from June 2020 at 0.6769. However, notice that the RSI is diverging from price, and indication that AUD/USD may be ready for a bounce. Resistance is near today’s high and previous support level at 0.6991. Above there, AUD/USD can move up to the May 4th highs at 0.7265.
Source: Tradingview, Stone X
Trade AUD/USD now: Login or Open a new account!
• Open an account in the UK
• Open an account in Australia
• Open an account in Singapore
Aluminum has been moving lower since fears of a slowdown began to sweep through the markets, and it is bringing AUD/USD lower with it. A slowdown in China will most likely mean less demand for Aluminum, as well as slower growth in Australia. This would cause the price of both Aluminum and AUD/USD to move lower. However, given the current positions of the RSI on both charts, perhaps it may be time for a near-term bounce.
Learn more about forex trading opportunities.
Latest market news
Yesterday 01:32 PM
Yesterday 09:35 AM
Yesterday 07:23 AM
Yesterday 04:48 AM
Yesterday 12:17 AM
July 25, 2024 10:39 PM
Latest Forex articles

Yesterday 12:17 AM

July 25, 2024 10:39 PM

July 25, 2024 03:59 PM

July 25, 2024 04:37 AM