

When is the July US CPI report?
The US Bureau of Labor Statistics (BLS) will release the July Consumer Price Index (CPI) report Wednesday, August 8 at 8:30 ET.
What are economists expecting for July CPI?
Consensus expectations are for headline CPI to come in at 0.2% m/m, 8.8% y/y, with the Core CPI report expected to print at 0.5% m/m, 6.1% y/y.
Last month’s headline CPI printed at 9.1% y/y, while the Core CPI was 5.9%.
CPI preview
We’ve seen dozens of nails hammered into the proverbial coffin of “team transitory” this year, but perhaps Jerome Powell and company can salvage a small win if inflation drops back below 9% this month.
The biggest factor suggesting that may be the case are gas prices, which have now fallen for over 50 straight days since the start of summer. Analysts estimated that gas prices fell at least 10% in July from June levels, likely subtracting 0.5% or more off the headline CPI reading this month. Likewise, food prices were also substantially lower in July than August, setting up a dynamic where the headline inflation reading may show price pressures fading while the Fed’s preferred “core” (ex-energy and food) CPI measure shows that underlying inflation is still rising as home prices and pent-up demand for economic reopening offset the more volatile components.
Beyond analysis of the individual components of inflation, there are some bigger-picture reasons to expect price pressures to moderate. Recent PMI surveys have indicated that businesses are seeing price pressures abate slightly, and according to the NY Fed, consumer inflation expectations for one year out are falling sharply. From a purely mechanical perspective, inflation was already picking up at this time last year, so the “base effects” from comparing current price increases to last year will make the top-line figures look less dramatic. We estimate that base effects will subtract roughly 0.5% from this month’s inflation forecasts on their own.
US CPI: Where next for the US dollar?
Using the US Dollar Index (DXY) as a proxy, the greenback has been riding its 50-day EMA higher for the past six months. As the chart below shows, the dollar index formed a “bullish engulfing candle” on the daily chart last week; for the uninitiated, this pattern signals a strong shift from selling to buying pressure and is often seen a significant lows in a market:
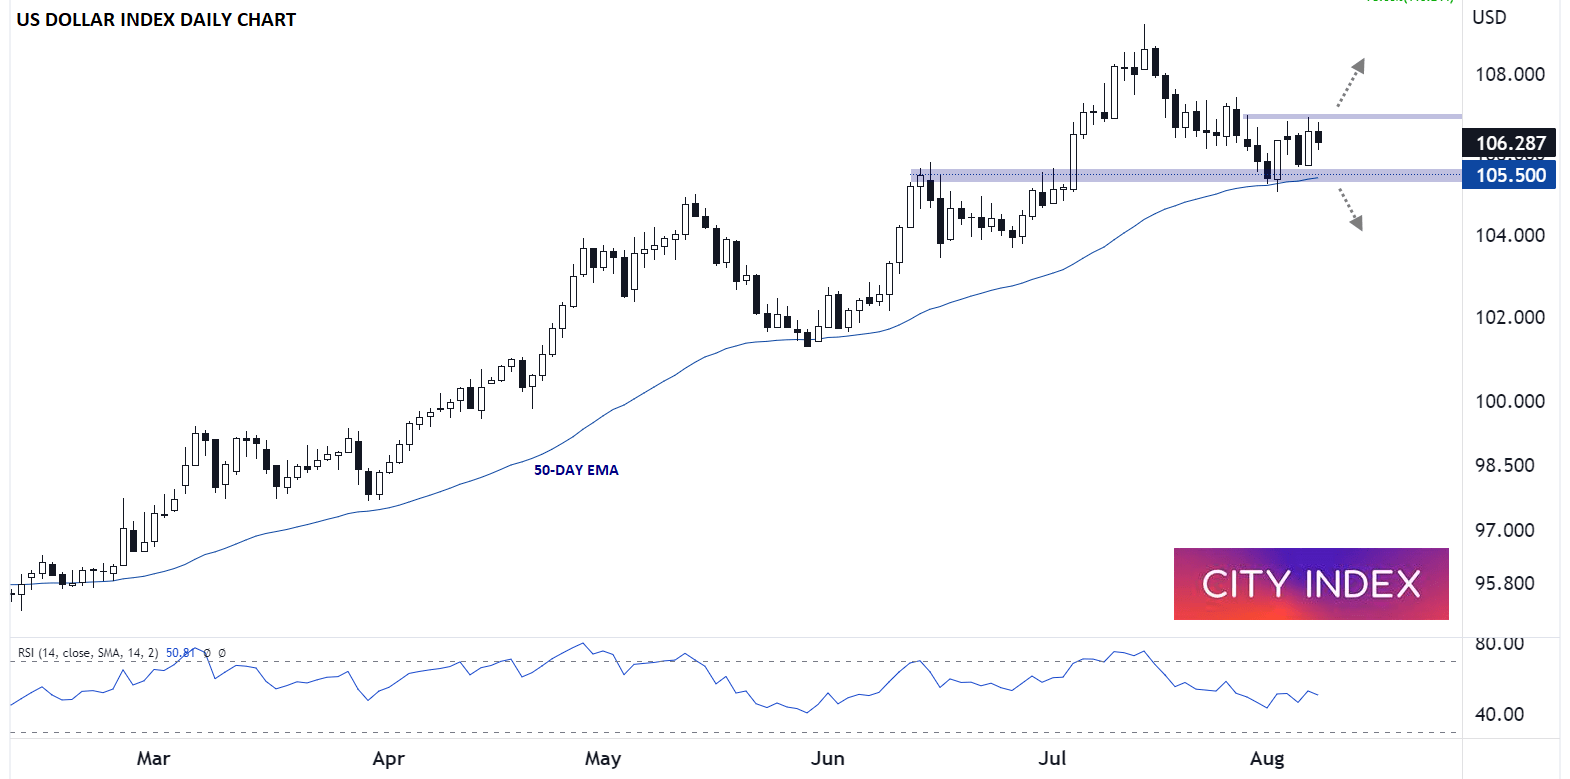
Source: StoneX, TradingView
If inflation comes in hotter than expected, it would tip the odds in favor of another 75bps interest rate hike from the Fed next month and likely boost the US dollar. A break above the 107.00 handle in that scenario could open the door for a potential retest of the dollar index’s June highs near 109.00. Meanwhile, a soft CPI report could weigh on the buck, with a move below the dollar index’s 50-day EMA near 105.50 suggesting that a deeper pullback toward 104.00 is likely.
How to trade with City Index
You can trade with City Index by following these four easy steps:
-
Open an account, or log in if you’re already a customer
• Open an account in the UK
• Open an account in Australia
• Open an account in Singapore
- Search for the market you want to trade in our award-winning platform
- Choose your position and size, and your stop and limit levels
- Place the trade
Latest market news
Yesterday 01:32 PM
Yesterday 09:35 AM
Yesterday 07:23 AM
Yesterday 04:48 AM
Yesterday 12:17 AM
July 25, 2024 10:39 PM
Latest Dollar index articles

March 22, 2024 11:00 AM

March 4, 2024 07:53 PM

February 16, 2024 11:30 AM

February 7, 2024 03:30 PM