May 17, 2022 3:24 PM

Anyone who is worried about the effects that inflation will have on household spending can take a deep breath for another month as April’s Retail Sales data continued to be strong. The headline Retail Sales print for April was 0.9% MoM vs 0.9% MoM expected and 1.4% MoM (revised higher from 0.5%!) in March. This was the fourth straight month of increases. The ex-Autos print beat estimates, coming in at 0.6% MoM vs 0.4% MoM expected and 2.1% (revised higher from 1.1%) in March. The strongest part of the data though came from the Ex-Gas and Autos component, which was 1% MoM was 0.7% MoM expected and 1.2% MoM (revised higher from -0.1%) in March. With the revisions, the data is strong and doesn’t point to any signs that the American consumer is ready to stop spending, despite inflation remaining near 40-year highs.
The US Dollar Index had a tough time trading through the 161.8% Fibonacci extension from the highs of April 28th to the lows of May 5th, near 104.90, as sellers entered the market and have been pushing DXY lower over the last 3 days (including today). The next horizontal resistance level above there is from a spike low in 2002 at 105.41. First support is at the May 5th lows near 102.35. Below there is horizontal support at the highs of April 19th near 101.00, just ahead of the 50 Day Moving Average at 100.71.
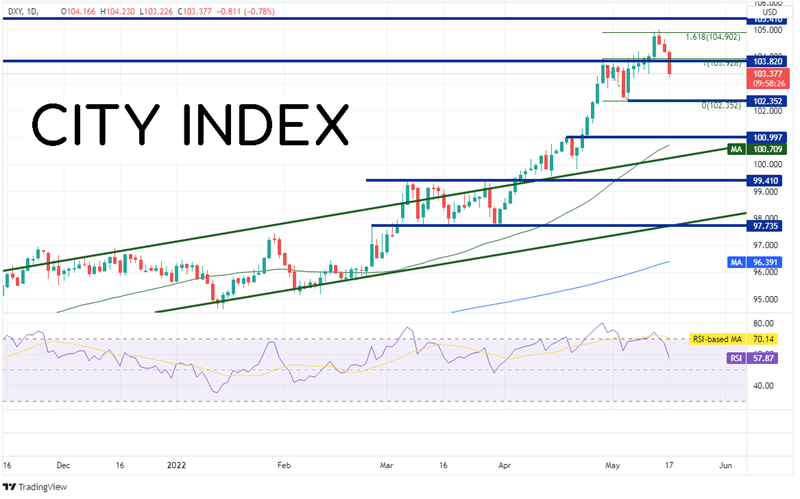
Source: Tradingview, Stone X
Trade the DXY now: Login or Open a new account!
• Open an account in the UK
• Open an account in Australia
• Open an account in Singapore
Given that EUR/USD makes up 57% of the US Dollar index, the pair has a high inverse correlation to the DXY. The bottom panel of the chart shows that the correlation coefficient is -0.98. A correlation coefficient of -1.00 is a perfect negative correlation, meaning the 2 assets move in the same direction 100% of the times. Therefore, when the DXY trades in once direction , EUR/USD often trades in the opposite direction.
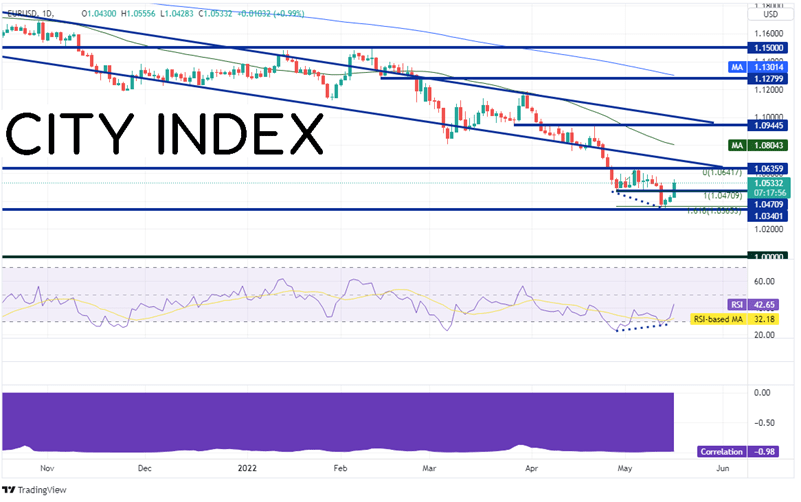
Source: Tradingview, Stone X
Trade EUR/USD now: Login or Open a new account!
• Open an account in the UK
• Open an account in Australia
• Open an account in Singapore
The pair has been moving lower for months. The selloff became aggressive when EUR/USD formed a shooting star candlestick on April 21st as price reached a daily high of 1.0936. However, EUR/USD failed to close below the 161.8% Fibonacci extension from the lows of April 28th to the highs of May 5th, near 1.0365. In addition, the pair failed to take out the lows of 2017 at 1.0340, which now acts as the first level of support. Below there, EUR/USD has room to fall to the psychological round number support level at parity (1.0000). Resistance is at the highs from May 5th at 1.0642 (which confluences with the March 2020 pandemic lows of 1.0635). The next level of resistance is the bottom, downward sloping trendline from the long-term channel near 1.0690 and then the 50 Day Moving Average at 1.0804.
Never underestimate the American consumer! Retail Sales continued to be strong in April despite high inflation. Is this just a correction at key levels for the DXY and EUR/USD or will they continue moving in their longer-term trends? Markets may learn more when Powell speaks later today.
Learn more about forex trading opportunities.
Latest market news
Yesterday 01:32 PM
Yesterday 09:35 AM
Yesterday 07:23 AM
Yesterday 04:48 AM
Yesterday 12:17 AM
July 25, 2024 10:39 PM
Latest Trade Ideas articles

Yesterday 09:35 AM

Yesterday 12:17 AM

July 25, 2024 10:39 PM

July 25, 2024 05:30 PM