

- What are economic indicators?
- What is the purpose of economic indicators?
- Types of economic indicators
- Gross domestic product (GDP)
- Interest rates
- Currency markets
- Stock markets
- Unemployment and wages
- Consumer price index (CPI)
- Product price index (PPI)
- Balance of trade
- Housing market
- Manufacturing activity
What are economic indicators?
Economic indicators are key pieces of data that are released in order to give insight into the performance of a country’s economy. They’re often referred to as macroeconomic indicators, as they show data on a large scale.
Macroeconomic indicators are used to analyse current and future trends – whether for investment purposes or to judge the health of an economy. Most economic indicators are official data releases, produced by governments or non-profit organisations.
What is the purpose of economic indicators?
The main purpose of economic indicators is to give an understanding of the state of an economy. For investors, traders and analysts, economic indicators provide information that can help them to discover new opportunities and adjust their portfolios.
Economic indicator announcements are widely followed, which means markets can move dramatically around each release as traders and investors adjust their positions. Therefore, most fundamental analysis will include economic indicators.
Traders and investors will keep an eye on analysts’ predictions for upcoming data releases to shape their trading strategies. If the actual figures are massively different from the expectations, there can be more volatility as everyone scrambles to adjust.
As most economic indicators are produced by or for policy makers, these indicators can also influence decisions going forward and ultimately change the course of political strategies.
Economic indicators will have a larger influence in the countries that they are about – ie UK data releases will have a more direct impact on the FTSE 100, British pound and UK companies than on other markets.
Types of economic indicators
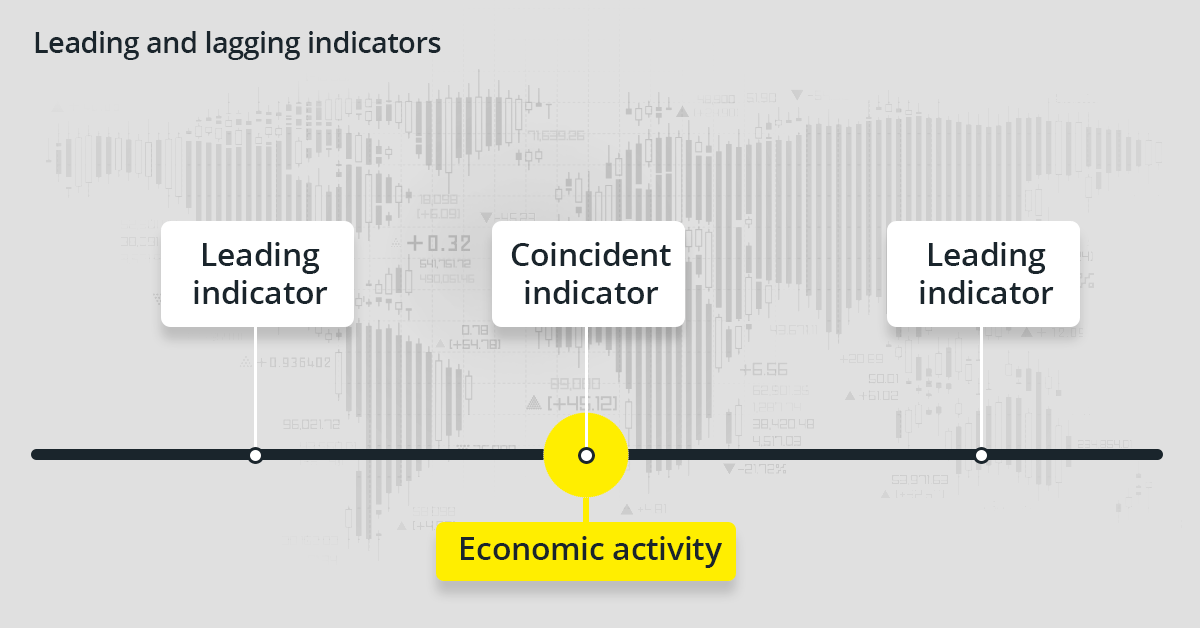
Economic indicators are divided into three broad groups:
- Leading indicators, which are used to predict future the movements and trends of an economy. These figures change before the economy does, which can be helpful for identifying opportunities but risky, as they’re not 100% accurate
- Coincident indicators, which are the result of specific economic activities. These indicators are useful metrics only for one particular area or region, but are real-time snapshots of the economy
- Lagging indicators, which trail the economy and are released after economic activity occurs. These aren’t necessarily useful for identifying trading opportunities, but provide essential insights into the health of an economy
Key macroeconomic indicators to watch
There are a number of data releases that can help traders and analysts understand changes to a country’s economy, the main ones are:
1. Gross domestic product (GDP)
Gross domestic product is the market value of all goods and services produced within a country during a given period. GDP is a lagging indicator, but it's also one of the most popular gauges of economic health.
GDP rates are usually given in comparison to the previous quarter or year, in order to show how much an economy is growing – a rising GDP indicates a country’s economy is expanding, while falling GDP rates show an economic contraction. For example, if the GDP of a country was up 2% in 2020, it would mean its economy had grown by 2% since the previous measurement in 2019.
There are usually two GDP figures given in a release: nominal and real. Nominal GDP is the standard value, which evaluates the value of goods and services at the current market price. Real GDP is this final value adjusted for price changes that occur over time.
The market responses to GDP shifts are often seen in stocks and indices, as an increase or decrease in GDP will show how much money businesses have been making during the period. A lot will also depend on how the real figures compare to analysts’ expectations.
Is GDP a good economic indicator?
GDP is considered a good economic indicator, as it accurately measures the size of the economy, while GDP per capita (per person in the economy) is closely linked to living standards over time.
However, GDP is a lagging indicator, which means there is only so much it can reveal about the outlook for an economy.
2. Interest rates
Interest rates are the percentage charged on loans or paid to the owners of savings accounts. The interest rate is set by a country’s central bank and is then trickled down to commercial banks and consumers. Interest rates are increased to curb inflation and lowered to promote growth.
Interest rates are one of the most influential factors for forex markets, due to the impact they can have on the value of currencies. Higher interest rates indicate a strong economy, which makes investors more likely to buy the currency, which leads to rising values. The rising interest rates also mean a higher rate of return for savings in bank accounts, which could encourage people to save instead of buying higher risk investments.
The reverse would be true if interest rates fell: the national currency would devalue and the low interest on savings accounts would make higher risk investments more worthwhile.
Are interest rates a good economic indicator?
Interest rates are useful as both a leading and lagging economic indicator. As changes to interest rates taken into account a recent period of economic activity, they are a lagging indicator for that period. However, once the decision to change an interest rate has been made, this will be a leading indicator for the next period of economic activity.
3. Currency markets
National currencies are used as a benchmark of the country’s economy, as their value a reflection of how much buyers and sellers think its worth.
A strong economy will encourage investment, and buyers will become willing to pay more for the currency – this provides a boost to the economy. When a country has a strong currency, its purchasing power rises so it can import products at a cheaper rate and sell products internationally at higher prices.
A weak economy discourages investment, which causes the value of a currency to decline. This reduces purchasing power, making it more expensive to import goods and making it cheaper for other countries to buy products. A weak economy can also boost tourism.
Want to trade currencies? Open an account with us today to get started.
Is currency strength a good economic indicator?
Currency strength is an extremely popular economic indicator. However, it’s a lagging indicator, as it’s a product of events that have already happened. This means using forex markets to understand economic movements should form just one part of analysis.
4. Stock markets
The stock market is a public venue where individuals and institutions come together to buy and sell the shares of companies and exchange traded funds (ETFs). Part investors’ analysis of stock prices looks at a company’s earnings and outlook, so it’s often thought that the direction of the stock market can be used to predict which direction the economy could move in.
For example, if company revenues are down across the board and the stock market is falling, the economy could be heading for a recession – and vice versa.
Learn how the stock market works.
Is the stock market a good economic indicator?
The stock market isn’t necessarily a good leading economic indicator because earnings estimates aren’t the only factor considered in stock prices. There is also a heavy amount of speculation on the stock market, which can manipulate prices to seem better or worse than they actually are.
For example, the phenomenon of a stock market bubble – when the price of an asset rises far beyond its true value – can give a false positive of economic health.
Governments have also been known to play a hand in manipulating stock markets in order to avoid panic during crises.
5. Unemployment and wages
Unemployment data and wages are statistics that look at the number of jobs in an economy and how much each individual is being paid for their work. The data is usually released a few times a year and is used to assess the levels of inactivity in the workforce.
High rates of inactivity coupled with lower wages is indicative of a period of recession, while low unemployment statistics and increasing wages shows the economy is growing. Unemployment figures are closely watched by traders and investors all over the world as periods of high unemployment are associated with declining stock prices.
An example of an unemployment date release would be the non-farm payrolls report from the US Bureau of Labor Statistics.
Is unemployment data a good economic indicator?
Unemployment data is usually collected by widescale surveys, which means its highly representative of the economy over a given period. However, the survey is just a snapshot in time – this means by the time the data is released, the statistics could be outdated. As a lagging indicator, unemployment data should be used as just one part of your analysis.
6. Consumer price index (CPI)
A consumer price index (CPI) measures changes in the cost of goods and services paid by consumers in a specific month. It essentially compares the cost of living over time and so can be used to gauge inflation levels.
Market participants pay close attention to CPI figures for signs of inflation – as rising inflation can cause higher interest rates and reduce borrowing, while deflation can lower interest rates and encourage lending.
Most countries will have their own consumer price index. It’s important to keep an eye on the CPI for any country you hold a vested interest in – whether that’s a position on stocks, indices or currencies.
Is the consumer price index a good economic indicator?
CPI is recognised as one of the leading indicators of inflation. However, it’s important to remember that it is a lagging indicator, so it may not be accurate for current levels of inflation. As with other indicators, CPI is best used as one part of your total analysis strategy.
7. Producer price index (PPI)
The producer price index tracks price changes in goods-producing sectors – including mining, manufacturing, agriculture, forestry and fishing – and an increasing number of non-goods producing sectors.
It measures changes in the selling prices for finished goods, intermediate goods and crude goods across thousands of companies. PPI assesses costs from the perspective of industries, whereas the CPI measures prices from the perspective of consumers.
Is the producer price index a good economic indicator?
The PPI is considered a great tool for looking at how prices change over the long term. They are often seen as a leading indicator for inflation, as the surveys show price changes, even before they appear at a retail level. PPI is also usually the first inflation data released in a month – so it’s the first insight investors get.
8. Balance of trade
Balance of trade (BOT) is the difference between the amount a country exports and imports over a given period. A country that has a higher level of imports than exports in terms of value is seen as having a trade deficit, and a country with a higher level of exports than imports has a trade surplus.
A trade surplus in generally seen as more desirable than a deficit, as it shows there is more money coming into a country than there is leaving it. Deficits can be a sign of domestic debt and even result in the national currency falling in price.
Is the balance of trade a good economic indicator?
On its own, a balance of trade tells us little about the economic health of a country. For example, the US – the richest nation in the world by GDP – has had a trade deficit since the 1970s. BOT should always be considered alongside other economic indicators.
9. Housing market
The housing market is a vital source of information about the economy. A decline in the number of new housing projects – known as house starts – or the price of properties shows that few people are looking to buy. A weak housing market has knock on effects to the rest of the economy – it reduces homeowner wealth, lowers employment in construction, and can force homeowners to default on their mortgages.
Data on construction and prices are readily available for both commercial and residential builds.
Is the housing market a good economic indicator?
The housing market is a popular leading indicator for economic activity, as companies need to apply for building projects six months before they intend to start constructions. These housing start stats show whether the demand for homes is rising or falling.
10. Manufacturing activity
Production and manufacturing data are some of the most widely used methods of assessing economic activity, as the statistics are taken from one of the first stages in the supply chain. The theory goes that an increase in manufacturing outputs will increase GDP further down the line – which is a sign of positive economic growth.
Changes in manufacturing activity can also be an indication of changes in employment rates. The higher the rates of manufacturing activity, the most likely companies will be to hire new staff to account for the excess production. However, when manufacturing companies stop hiring, it’s an indication that they’re getting ready for a slump in activity.
The Purchasing Manager’s Index (PMI) is a commonly used indicator of manufacturing activity.
Is the manufacturing activity a good economic indicator?
The PMI is believed to be an especially good indicator of economic activity as it shows when companies stop purchasing raw materials – this can indicate problems in an economy before other reports such as PPI and CPI.
Latest market news
Yesterday 01:32 PM
Yesterday 09:35 AM
Yesterday 07:23 AM
Yesterday 04:48 AM
Yesterday 12:17 AM
July 25, 2024 10:39 PM
Latest Insights articles

March 21, 2024 04:05 AM

February 12, 2024 02:44 PM

February 9, 2024 04:37 PM

February 8, 2024 06:25 PM