

WTI oil falls as Shanghai enters lockdown
Oil prices are tumbling lower after China announced a partial lockdown in Shanghai, the financial hub home to 25 million people.
COVID cases in the city have risen quickly, and China maintains its zero-COVID policy. The move has prompted demand fears.
The drop in oil comes after an 8% rise in prices last week, and as oil is set to rise 14% across the month of March amid the ongoing Russia Ukraine war, which sparked supply fears.
Russia is the world’s second-largest oil exporter of around 5 million barrels a day. Estimates suggest between 1-3 million barrels a day may not make it to market.
Learn more about trading oilWhere next for oil prices?
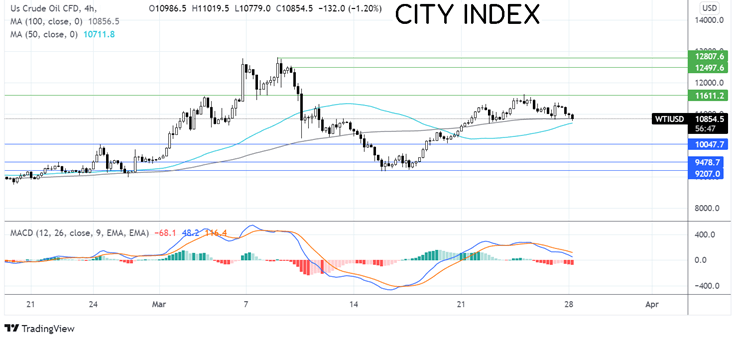
WTI oil traded relatively range-bound last week, with gains limited by 116.30 and losses limited by the 100 SMA on the four-hour chart around 108.50.
The MACD hints towards further declines, and sellers could gain traction if the zero line is crossed. Sellers would need to break below the 100 SMA at 108.50, exposing the 50 sna at 107.20. A break below here could open the door to the critical psychological level at $100.
Buyers could look for a move over 116.30 to 125.00, the March 9 high ahead of 128.20.
AUDJPY surges after dovish BoJ, Australian infrastructure spend
AUDJPY rise to a seven-year high after the BoJ offered to buy an unlimited amount of JGBs at 0.25% in a dovish move by the central bank.
Meanwhile, the Aussie is bounding higher, boosted by an announcement of AUD$17.9 billion in infrastructure spending by Prime Minister Morrison ahead of the coming elections in May.
The AUD could find gains are limited by the lockdown in China and the general risk-off mood in the market, which often hurts demand for the riskier Aussie.
Looking ahead, Australian retail sales data is due and is expected to show sales rose 1% MoM in February, slightly down from the 1.5% rise in January.
Learn more about when to trade forexWhere next for AUDJPY?
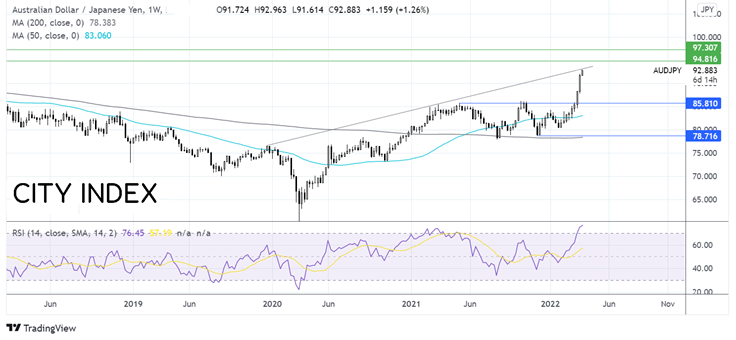
AUDJPY broke out of its trading range within which it traded since May last year, pushing above 85.50 and propelling higher. The price has run into resistance at 93, the rising trendline dating to late 2019.
The RSI has pushed into overbought territory, so some consolidation at this level; could be on the cards before further gains.
A break above the multi-year rising trendline could see bulls look to 94.70, the March 2015 high ahead of 97.50 the 2015 high.
Sellers would look for a move below 86 to negate the current uptrend and expose the 50 sma at 83.00.
How to trade with City Index
Follow these easy steps to start trading with City Index today:
- Open a City Index account, or log-in if you’re already a customer.
- Search for the market you want to trade in our award-winning platform.
- Choose your position and size, and your stop and limit levels
- Place the trade.
Latest market news
Yesterday 01:32 PM
Yesterday 09:35 AM
Yesterday 07:23 AM
Yesterday 04:48 AM
Yesterday 12:17 AM
July 25, 2024 10:39 PM
Latest Trade Ideas articles

Yesterday 09:35 AM

Yesterday 12:17 AM

July 25, 2024 10:39 PM

July 25, 2024 05:30 PM