

EUR/GBP eases ahead of ECB
EURGBP is edging a few points lower, snapping a three-day winning run ahead of the ECB interest rate decision.
The pair rallied 1% yesterday as Ukraine indicated that it was open to neutrality, and Russia also softened its stance. The third round of peace talks today will be watched closely.
The ECB is not expected to change monetary policy today. Expectations of a rate hike have been dialed back given the Ukraine crisis, but surging inflation still needs to be addressed, putting the ECB in a challenging position. We expect the ECB to hold back on its hawkish transition.
There is no high impacting UK data due to be released.
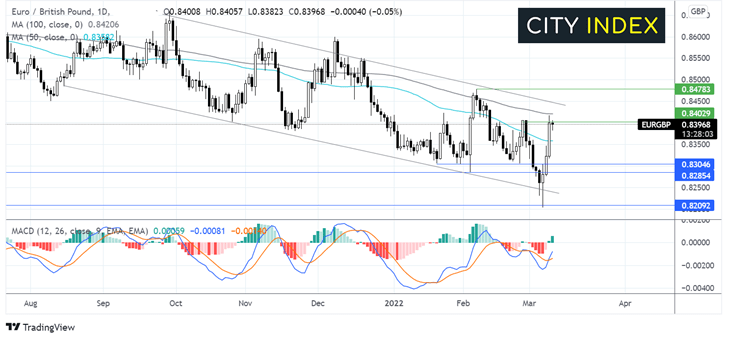
Where next for EUR/GBP?
EURGBP has extended its rebound from the five-year low of 0.82 back into the falling channel and to resistance at the 100 sma. The bullish crossover on the MACD, in addition to a move above the 50 SMA, is keeping the bulls hopeful of further gains.
However, any move higher would need to break above the 100 SMA to target 0.8450, the upper band of the falling channel.
On the downside, a more dovish tone from the ECB could see sellers head back towards the 50 sma at 0.8362 ahead of 0.83 the horizontal support, which has limited losses on several occasions across 2022.
US Dollar Index rises ahead of CPI data.
US dollar fell yesterday on safe-haven outflows as risk appetite returned on hopes of a diplomatic breakthrough in peace talks.
In addition to the third round of talks, US inflation data will be under the spotlight today. Expectations are for CPI to rise to 7.9% YoY in February, up from 7.5% in January.
Fed Chair Powell signaled a 0.25% rate hike in March but said that the Fed could adopt a more aggressive stance should inflation jump higher, which now looks likely given that oil prices have risen over 20% in a week.
Hotter inflation could boost the USD higher amid expectations of more rate hikes. Meanwhile, a softer print could pull the USD lower, although this is likely to be short-lived given March’s jump in energy prices.
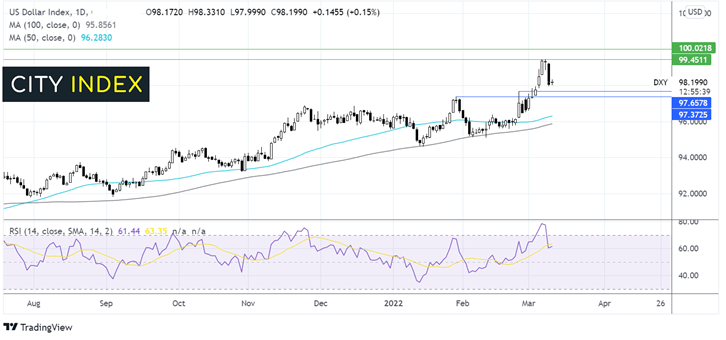
Where next for DXY?
DXY has been trending higher, forming a series of higher highs and higher lows. The price ran into resistance at 99.40, a 22-month high.
The recent fallback has brought the RSI out of the overbought territory for his first time in a week, suggesting that yesterday’s selling was a technical move. The RSI remains in bullish territory above 50.
Buyers will be looking towards resistance at 99 and 99.40 could prove to be a tough nut to crack ahead of the key 100 psychological level.
It would take a move below 97.70 to open the door to 97.30 and 97.00, with a move below this level negating the near-term uptrend.
How to trade with City Index
Follow these easy steps to start trading with City Index today:
- Open a City Index account, or log-in if you’re already a customer.
- Search for the market you want to trade in our award-winning platform.
- Choose your position and size, and your stop and limit levels
- Place the trade.
Latest market news
Yesterday 01:32 PM
Yesterday 09:35 AM
Yesterday 07:23 AM
Yesterday 04:48 AM
Yesterday 12:17 AM
July 25, 2024 10:39 PM
Latest USD articles

Yesterday 01:32 PM

July 25, 2024 01:17 PM

July 24, 2024 01:43 PM

July 22, 2024 02:47 AM