

It was the Nasdaq 100 which took the lead on Thursday as it inched its way to a fresh all-time high. I’ll admit to not being convinced by it, given it only closed a few points above the December high. Yet Wall Street indices moved higher in tandem on Friday with bullish range-expansion bars which also saw the S&P 500 and Dow Jones print new all-time highs.
Monday’s open also appeared to be off to a strong start, with all three indices gapping higher at the open and extending their lofty gains. Yet the gains were not to last, and clues are building that the rally may be nearing a point of exhaustion.
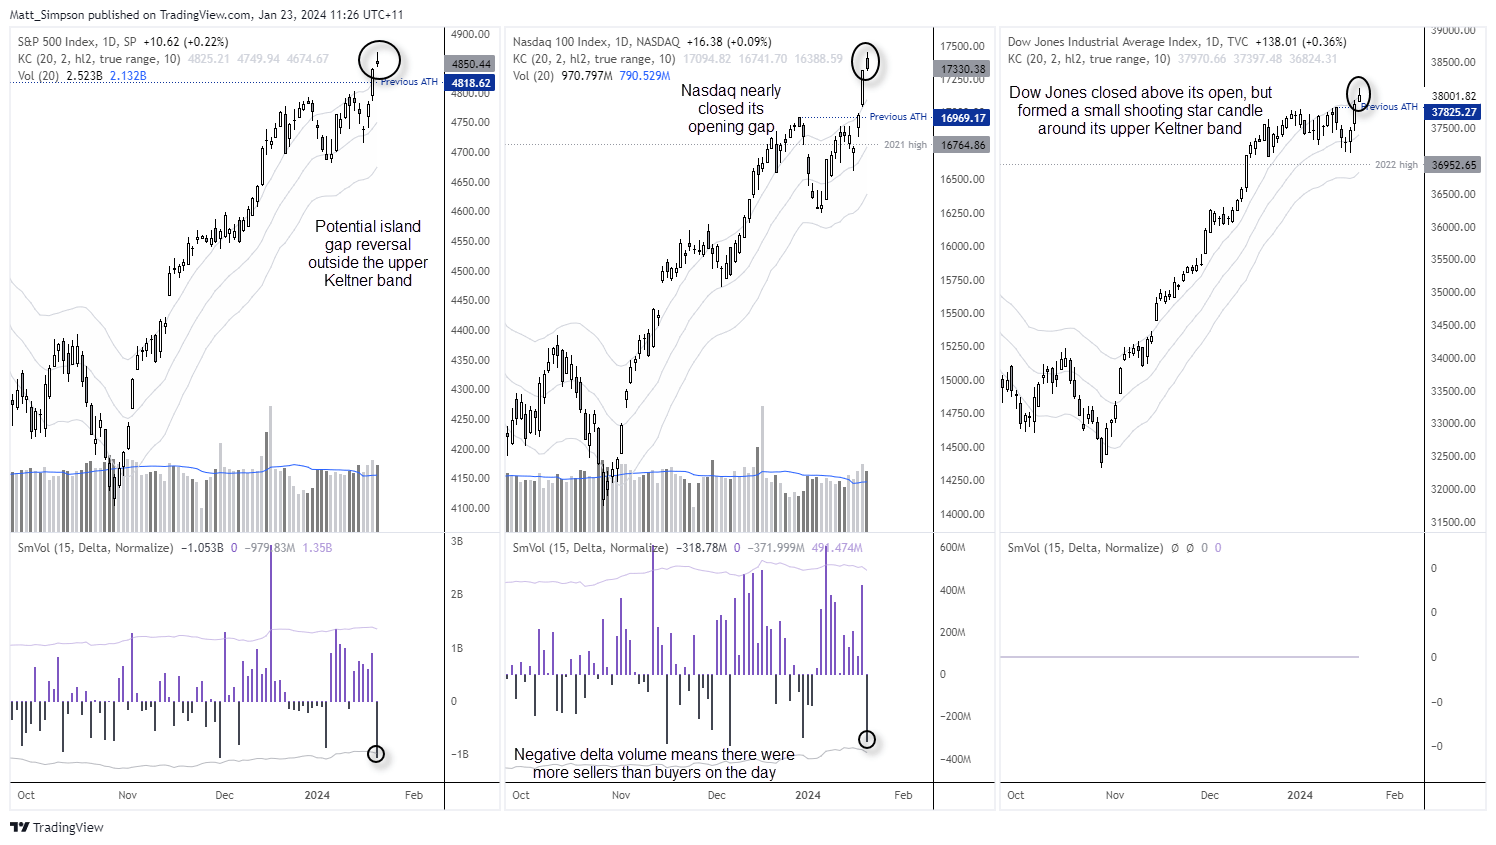
The Nasdaq 100 closed lower on the day with a small upper wick and nearly closed its opening gap. Whilst the S&P 500 kept most of its gap open, a potential island reversal candle has formed. We need to see prices gap lower at the open on Tuesday to confirm it as such, but they can mark important market tops. And whilst the Down Jones closed above its open, two-thirds of the daily range are found at the upper wick, which means a potential shooting star candle has formed at a record high.
Furthermore, the daily ranges were relatively small and coupled with above-average volume, which can signify a ‘change in hands’ between buyers to sellers. This is confirmed with the negative delta volume as it means there were more offers (sellers) than bids (buyers). I only have access to volume data for the S&P 500 and Nasdaq 100, but two out of the three is good enough for me to assume something is not right at these highs. And finally, the fact we have seen such small-ranged, high-volume candles which formed beyond the upper Keltner band on the S&P 500 and Nasdaq, and on it for the Dow Jones, further suggests the rally is at the very least losing steam.

AUD/USD, NZD/USD hint at round of risk-off
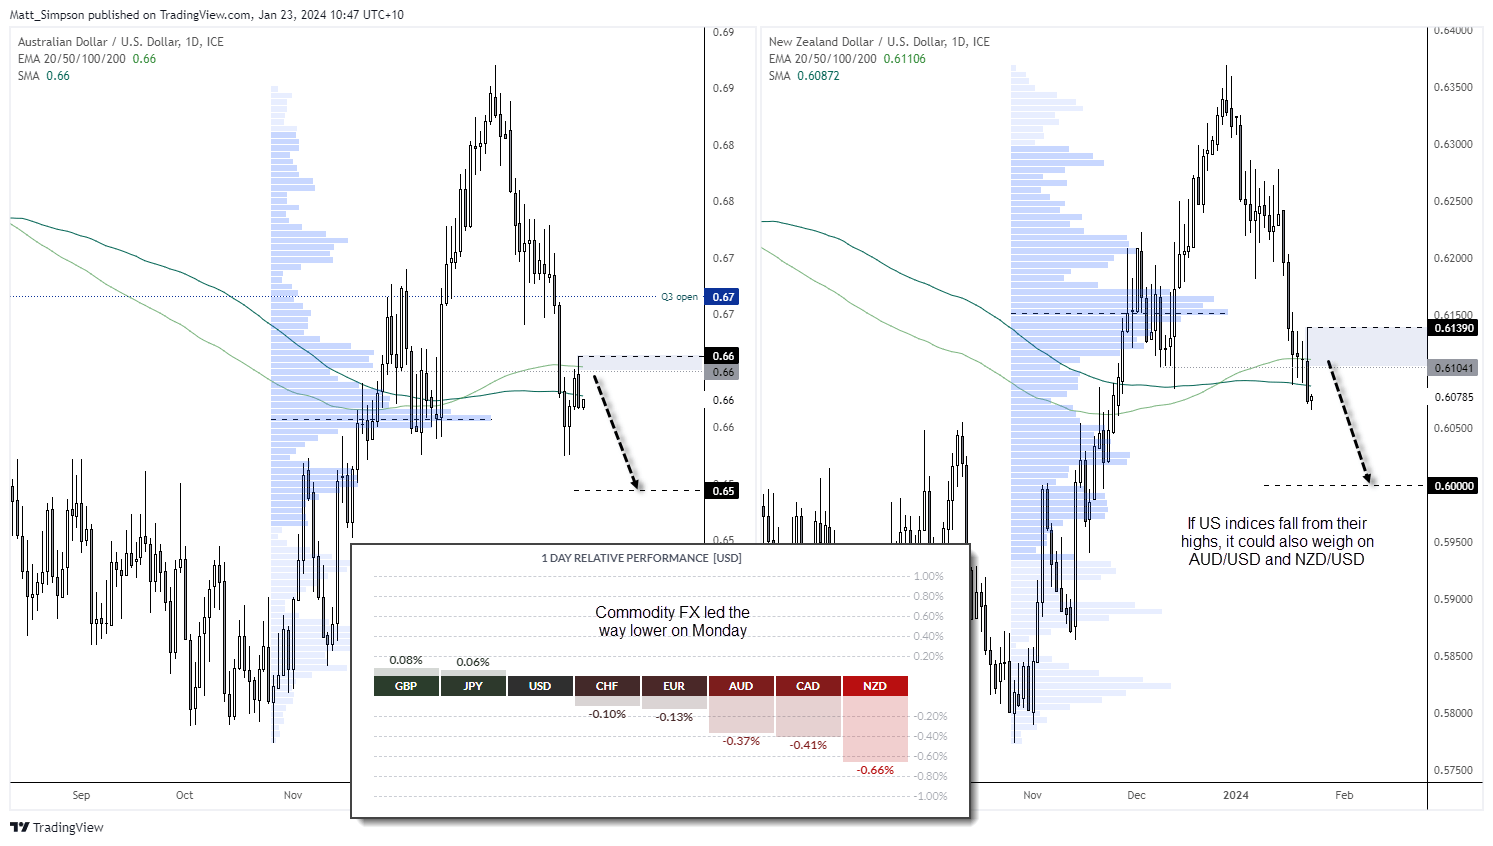
We also have bearish clues form the commodity FX space, which tend to underperform during bouts of risk off. Both AUD/USD and NZD/USD formed bearish outside days and closed beneath their 200-day averages and EMAs. Should prices remain beneath 66c, then AUD/USD bears seem to have 65c in mind whilst NZD/USD bears likely have 60c in mind. And if risk-off ensues, it likely means a pullback for US indices from their record highs and another leg lower for AUD/USD and NZD/USD.
-- Written by Matt Simpson
Follow Matt on Twitter @cLeverEdge
How to trade with City Index
You can trade with City Index by following these four easy steps:
-
Open an account, or log in if you’re already a customer
• Open an account in the UK
• Open an account in Australia
• Open an account in Singapore
- Search for the market you want to trade in our award-winning platform
- Choose your position and size, and your stop and limit levels
- Place the trade
Latest market news
Yesterday 01:32 PM
Yesterday 09:35 AM
Yesterday 07:23 AM
Yesterday 04:48 AM
Yesterday 12:17 AM
July 25, 2024 10:39 PM
Latest Trade Ideas articles

Yesterday 09:35 AM

Yesterday 12:17 AM

July 25, 2024 10:39 PM

July 25, 2024 05:30 PM