July 14, 2022 5:13 PM

The Producer Price Index (PPI) isn’t as widely followed by the markets as the Consumer Price Index (CPI). However, after yesterday’s sizzling CPI print for June of 9.1% YoY, markets are looking for any signs of a slowdown in inflation. Today isn’t that day. The headline June PPI print was 11.3% YoY vs 10.7% YoY expected and a higher revised May print of 10.9% YoY. A majority of the increase was due to the increase in gasoline prices. In addition, the Core PPI for June, which excludes energy and food prices, was 8.2% YoY vs 8.1% YoY expected and 8.3% YoY last. As a result of yesterday’s CPI print, as well as today’s PPI print, the US Dollar has continued to move higher.
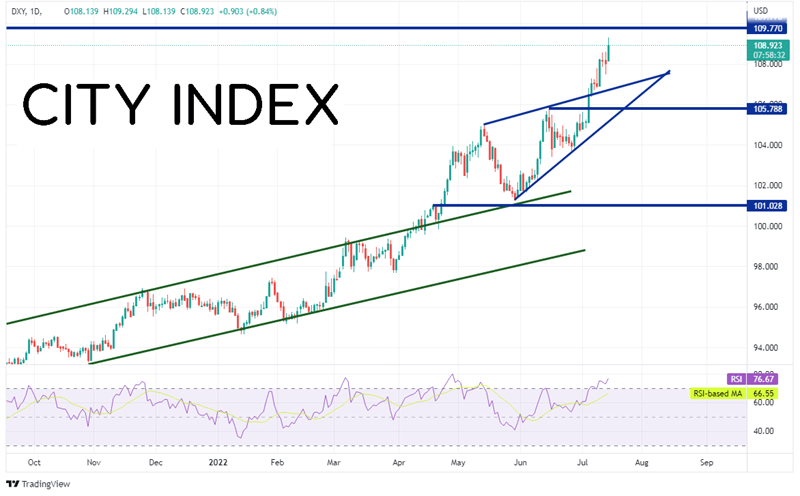
The US Dollar Index (DXY) continues to defy gravity as it continues its lofty ascent. The index has been moving higher since March of 2021 and recently broke above the top, upward sloping trendline of an ascending wedge. Typically, expectations are that price would break lower out of an ascending wedge. Horizontal resistance above sits at the highs of September 2002 at 109.77 and the lows from September 2001 at 111.31. However, the RSI is in overbought territory, indication the DXY may be ready for a near-term correction. Support below is at the upward trendline of the wedge near 106.75. Below there is horizontal support at 105.79 and then the bottom trendline of the wedge near 105.15.
Source: Tradingview, Stone X
Trade the DXY now: Login or Open a new account!
• Open an account in the UK
• Open an account in Australia
• Open an account in Singapore
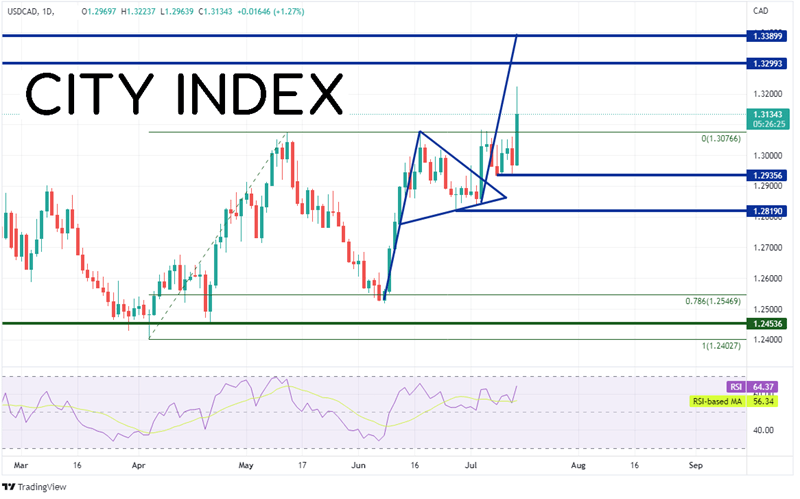
In addition, despite the Bank of Canada hiking interest rates by 100bps yesterday, USD/CAD came back better bid today as the US Dollar dominates. On a daily timeframe, USD/CAD had been trading in a range between 1.2498 and 1.3075. The pair bounced off the 78.6% Fibonacci retracement of that range and began moving higher in a pennant formation, testing the top of the area multiple times. On July 5th, USD/CAD broke out of the pennant formation and began moving towards the target near 1.3390. Today, price finally busted above the 1.3075 area and reached an intra-day high of 1.3224. The next resistance level isn’t until 1.3300, the highs from November 4th, 2020 and then 1.3390, the highs from October 29th, 2020. However, if USD/CAD can’t continue higher, first support is at the previous highs of 1.3075, then the July 8th lows at 1.2936. Below there, price can pull back to the lows of the pennant at 1.2819.
Source: Tradingview, Stone X
Trade USD/CAD now: Login or Open a new account!
• Open an account in the UK
• Open an account in Australia
• Open an account in Singapore
As the DXY continues to make new daily highs, it appears that inflation is still at the forefront of traders’ minds, with worries of a global slowdown right behind it! Today’s PPI data didn’t do much to calm their fears, as the higher than expected print in followed in lockstep with the CPI data released yesterday. Tomorrow, the US will release the Michigan Inflation Expectations Index. Watch to see if consumers believe inflation will be lower in the future.
Learn more about forex trading opportunities.
Latest market news
Yesterday 01:32 PM
Yesterday 09:35 AM
Yesterday 07:23 AM
Yesterday 04:48 AM
Yesterday 12:17 AM
July 25, 2024 10:39 PM
Latest Trade Ideas articles

Yesterday 09:35 AM

Yesterday 12:17 AM

July 25, 2024 10:39 PM

July 25, 2024 05:30 PM