

Momentum trading is a popular strategy for finding opportunities in short-term volatility. Find out how momentum trading works, and which indicators you can use.
What is trading on momentum?
Momentum trading is a strategy that involves taking a position based on the strength of a market trend. It’s a popular way of trading in volatile markets, as the goal is to find opportunities in short-term trends.
Momentum trading follows the premise that if there’s enough force behind a move, it will continue, and once that wanes, the market will reverse. It’s the idea of ‘buying high and selling higher’ – that once a trend gains enough traction, it will continue in the same direction. But it doesn’t always have to be a bullish move, it can apply to falling markets too.
Like trend trading, individuals would look to open a position as close to the start of a trend as possible and close it before the market reaches an exhaustion point. A momentum trader won’t necessarily be looking to find the top and bottom of a trend, but look for confirmation signals that a trend is going to continue gaining strength.
How does momentum trading work?
Momentum trading works using the principle of ‘herding’, that traders and investors copy the behaviour of other market participants. It’s the fear of missing out that drives more and more individuals to jump into a trend.
Learn about trading psychology
So, the two key aspects of whether momentum trading will work or not are volume and volatility.
Volume is needed for any trade to ensure there are enough willing participants on the market to take the opposite side of a trade. So, when you start to formulate a momentum strategy, it’s important to look at what time of day your chosen market has the most volume.
Take a look at our guide to trading times:
Momentum trading is also based on the idea that volatility is a good thing because traders can find opportunities in smaller but more frequent positions.
So, rather than buying and holding a position, momentum traders would only hold a position for as long as it takes the market to show signs of reversing as momentum wanes and changes direction.
However, this doesn’t mean momentum trading is only suited to short-term traders. A trend can continue to have strength behind it for sustained periods, making it a popular choice for day traders and position traders alike.
Is momentum trading suitable for day traders?
Momentum trading is favoured by day traders as volatility is their bread and butter. Plus, they only need to locate the direction of an existing trend and whether it will continue, rather than finding the exact start and end of the move.
This can make it quicker to identify opportunities. However, it’s still important to do your research and not just rush into any market that seems to have momentum.
Is momentum trading suitable for swing traders?
Momentum is suitable for swing traders. The goal of a swing trading style is to buy and sell at support and resistance levels, usually over shorter durations.
Momentum strategies can be used as part of a swing style, as its at levels of support and resistance that using momentum indicators is most useful. They can tell traders whether the market is reaching an exhaustion point, where momentum is slowing, or whether a breakout is possible.
Is momentum trading suitable for scalpers?
Yes, in fact, for the most part, scalp trading is based on momentum. In most momentum strategies, traders are only looking to benefit from the body of a trend. In scalping momentum strategies, the individual is trying to enter ahead of momentum, entering a move at the start and closing the position before the momentum dissipates.
Is momentum trading suitable for position traders?
Position trading is probably the least suitable style for momentum trading, but that’s not to say it’s not possible. Momentum can be followed over longer-time frames too, such as weeks or months.
Momentum trading can be used as a shorter-term investment strategy for those looking to build a more active portfolio.
If you are looking to use momentum trading for investing, it’s even more important to only focus on securities that have enough volume to trade. Popular stocks – such as blue chips – are the most commonly used as they have the most liquidity for short-term plays.
Momentum trading is more time-consuming than most other position strategies. Even though you’re taking a position for the longer term, you’d still need to be on the ball with your analysis of the market. You don’t want to miss the turning point in momentum. So, it’s important to think about how much of your day you want to dedicate to watching momentum levels.
Learn more about styles and strategies
How to trade momentum
- Open a live trading account or a demo account
- Choose a market to trade
- Build an indicator system
- Attach risk management tools
To start trading momentum, you will need to consider the asset that you are interested in.
Momentum trading can be used across all financial markets, but it’s most common for stock traders and forex traders, due to the levels of volume and volatility they experience. Let’s take a look at both in more detail.
Momentum forex trading
The forex market is incredibly volatile, and also has some of the deepest liquidity due to the sheer number of participants involved – whether that’s individuals, institutions or banks.
Momentum and trends in the forex market are strongest around key data releases – such as the consumer price index (CPI), employment figures and retail sales – as well as central bank announcements.
Learn about economic indicators
Momentum stock trading
Although the stock market is less volatile than forex, there’s still a high volume of traders actively buying and selling every day. This means share prices are constantly changing – whether from earnings, company news, or macroeconomic factors, such as inflation.
So, momentum strategies can help traders take advantage of the body of a trend, rather than having to find the top and bottom of one. A valuable tool for traders looking to use momentum is a stock screener, which can show the percentage change each day.
Best momentum indicators
There are several different indicators that can help traders identify the strength of a given trend, as well as chart patterns that can give insight into market movements.
Here are some of the most used by momentum traders:
1. RSI
The most commonly used momentum indicator is the relative strength index (RSI). It is an oscillator that helps you predict future market direction and assess whether momentum is speeding up or slowing down.
The indicator moves on a scale from 0 to 100 – a reading above 70 shows an asset is overbought, and a reading below 30 shows it’s oversold.
Momentum strategists can use these levels to find clear trends – opening positions once the market starts rebounding off these levels.
Learn more about the RSI in our technical analysis course
2. Stochastic oscillator
The stochastic oscillator is used to compare the most recent closing price to the previous trading range. It helps identify the speed and strength of a trend over a given period.
Like the RSI, the stochastic has an indicator line that oscillates between 0 and 100. A reading over 80 indicates the market is overbought, and a reading below 20 means it’s considered oversold.
But the stochastic also has a signal line. When the signal line and the indicator line cross, it’s a signal that the market is likely to change direction.
Learn more about the stochastic oscillator in our technical analysis course
3. Moving averages
Moving averages help identify price trends by smoothing out price action and reducing the noise that comes from short-term fluctuations. You can use a MA over a range of different periods – making it suitable for both long-term and short-term strategies.
When the market price closes above the MA, it would indicate a bullish trend and a buy signal. When the market price closes below the MA it would indicate a bearish trend and a sell signal.
You can also overlay a fast MA and a slow MA for a crossover strategy – when the two meet and cross each other, it’s a signal to enter or exit the trade.
When the shorter-term period MA crosses above the long-term timeframe MA, it usually means that the market is in an uptrend. The opposite is true when the short MA crosses below the long MA, the market would be in a downtrend.
Learn more about moving averages in our technical analysis course
4. Flag patterns
Flag patterns can be used to assess whether there is still momentum in a given trend.
Bull flags are a bullish pattern, which is formed by two rallies with a short consolidating retracement in the middle between lines of support and resistance.
The first rally is the flagpole, and the pullback between trendlines is the flag, followed by another breakout.
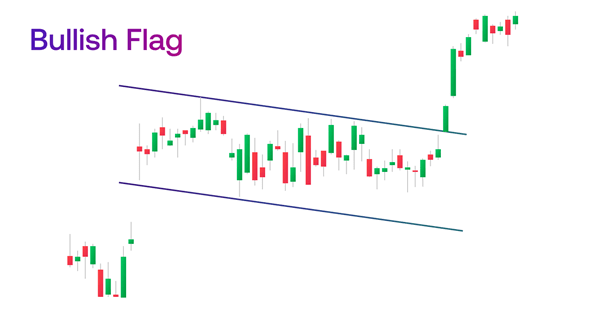
The pattern illustrates that there is still support for the uptrend, as the retracement isn’t turning into a reversal. The bulls are still in control of the market and push it up into another rally.
A bear flag is the complete opposite. It shows that there is still downward momentum, despite a brief period of bullish reversal trading between support and resistance lines.
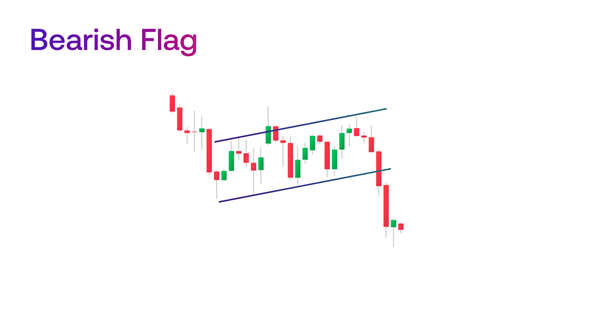
These chart patterns offer traders key entry points into a trend that has continued momentum, which would be the first candlestick that forms in the breakout.
In a bull flag, it would be the first green candle to trade above the resistance level, and for bear flags it would be the first red candle to form below the support.
It’s always a good idea to attach a stop-loss order too, to protect you from risk should the market not move in the direction you predict.
Momentum trading FAQs
Is momentum trading profitable?
Momentum trading can be profitable, but like any strategy, it can be incredibly unprofitable if you’re wrong and the market moves in a different direction. That’s why it’s so important to do your research and have the appropriate risk management tools attached to your trades.
What are the best stocks for momentum trading?
The best stock for momentum trading will depend on several factors, such as the timeframe you’re looking to trade over. Some stocks will only change in price a few points in an hour, while others experience more volatility.
What is the best time frame for momentum trading?
Momentum trading can be used in any market and over any timeframe. It’s popular among short-term traders – such as day traders and scalpers – who want to enter and exit multiple positions a day, as well as longer-term position traders and investors.
Learn more about CFDs vs investing
Latest market news
Yesterday 01:32 PM
Yesterday 09:35 AM
Yesterday 07:23 AM
Yesterday 04:48 AM
Yesterday 12:17 AM
July 25, 2024 10:39 PM
Latest Insights articles

March 21, 2024 04:05 AM

February 12, 2024 02:44 PM

February 9, 2024 04:37 PM

February 8, 2024 06:25 PM