


When you analyse trading charts, you’ll see certain formations crop up repeatedly. Some traders use these to find new opportunities. Here, we’re going to explore the chart patterns you should know and recognise.
What is a chart pattern?
A chart pattern is a set price action that is repeated again and again. The idea behind chart pattern analysis is that by knowing what happened after a pattern in the past, you can take an educated guess as to what might happen when it appears again.
The outcome of each chart pattern will vary depending on whether it appears in volatile or calm markets, and in bullish or bearish environments. But broadly speaking, there are three types of pattern you’ll come across.
Common types of chart patterns
- Continuation - these signal a current trend will continue
- Reversal - these indicate a trend is going to change direction
- Bilateral - these patterns indicate a market could move in either direction due to volatility
Now that we know the basics, let's look at some of the most common chart patterns in technical analysis.
11 chart patterns for trading
- Ascending and descending staircases
- Ascending triangle
- Descending triangle
- Symmetrical triangle
- Flag
- Wedge
- Double top
- Double bottom
- Head and shoulders
- Rounded top or bottom
- Cup and handle
Note: as candlestick charts are usually the default for traders, that’s what we’ll look at in this lesson, but you can identify these patterns with bar charts too.
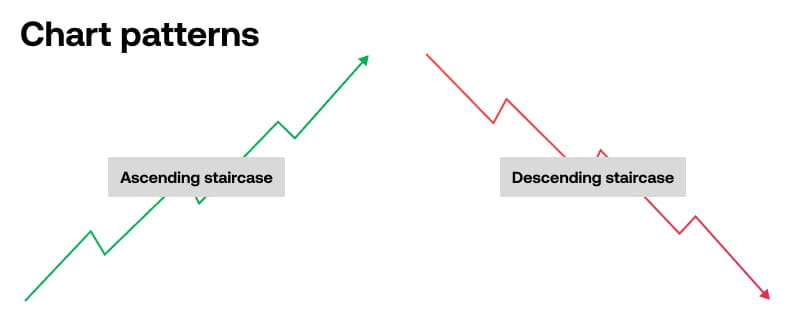
1. Ascending and descending staircase
Ascending and descending staircases are probably the most basic chart patterns. But they’re still important to know if you’re interested in identifying and trading trends.
Take a look at any market, and you’ll notice that price action is rarely linear. Even in strong uptrends and downtrends, you’ll see some movement against the prevailing momentum.
In an ascending staircase, a market is moving upwards. While it retraces occasionally, it is still hitting higher highs and the lows are getting higher too. This is what a bull market generally looks like, and traders will consider going long until the uptrend comes to an end.
The dips in the trend can even provide useful buying opportunities, enabling you to get in on the rally at a discount.
When markets are forming lower lows and lower highs this can be considered a downtrend and forms a descending staircase. In this phase, traders would consider trading on the short side of the market. And in a downtrend, a trader could use the mini rallies that go against the bear run as opportunities to sell.
2. Ascending triangle
The ascending triangle is a chart pattern that’s created when a horizontal set of highs is met by an ascending set of lows. The upper horizontal line is the resistance level, and the lower upward sloping line is support.
It is a continuation pattern, usually appearing after an uptrend. Over the course of the pattern, the market consolidates (which means the trend stalls), but if it breaks out above the resistance line then a new uptrend should form.
As we’ll cover below, traders usually look to confirm a pattern before they start trading. One way to confirm an ascending triangle is to look at volume indicators – activity should decline within the pattern, but then quickly pick up as the breakout takes hold. If this arises, then the price is more likely to continue upwards.
Although the price does typically break out in the same direction as the prevailing trend, it doesn’t always happen. Ascending triangles can also indicate the start of a downtrend if price breaks lower or volume declines.

Learn more about how to trade triangles
3. Descending triangle
The descending triangle is the opposite of an ascending one. It usually occurs after a downtrend, and is formed when a horizontal set of lows (the support level) is met by a descending set of highs (resistance).
It’s also considered a continuation pattern, telling us that the market is likely to break out lower through the support level, making it a bearish signal. However, if the market breaks out through resistance instead, it may mean the beginning of a new uptrend.
As with its ascending counterpart, falling volume within the pattern followed by a spike as the market breaks out can make for a stronger signal.

4. Symmetrical triangle
Symmetrical triangle patterns occur when two trend lines approach one another. Essentially, it’s like if you overlaid an ascending triangle onto a descending one – and got rid of both of the horizontal lines.
The symmetrical triangle can signal a few different things, depending on market conditions.
It’s often considered a continuation pattern because the market usually continues with the prevailing trend. However, if there is no clear trend before the pattern forms, it’s a bilateral pattern and the price could go in either direction. Once a breakout in either direction is confirmed, it suggests that the trend is likely to continue in that direction.
To trade a symmetrical triangle, be ready for the market to break out in either direction. Then watch to see whether that turns into a new trend, and buy or sell accordingly.

5. Flag
A flag pattern is created when a market’s support and resistance lines run parallel to each other, either sloping upwards or downwards. It culminates in a breakout in the opposite direction to the trendlines.
- In a bullish flag, both lines point downwards and a breakout through resistance signals a new uptrend
- In a bearish flag, both lines point upwards and a breakout through support signals a new downtrend
Although they can be considered as reversal patterns – after all, the price action within the flag reverses when the breakout occurs – flags are usually classed as continuation signals because they tend to occur after uptrends (bullish flags) and downtrends (bearish flags).
Think of it in three parts: a strong directional move, followed by a slow counter trend – the ‘flag’ – and a breakout.

6. Wedge
A wedge pattern is similar to a flag, except that the lines tighten toward each other instead of running parallel. As the pattern progresses, it often coincides with a decline in volume.
A wedge pattern can either be rising or falling. After a rising wedge pattern, the market should break out downward, passing the support level. This presents opportunities for a new bearish position, or might be a sign to close a long one.
For a falling wedge, the price should break through a resistance level to start an uptrend. You can open a long position at this point, or close a short one.
Some traders even choose to enter short-term trades within the wedge pattern, taking smaller profits from the oscillations between support and resistance.

Learn more about the wedge pattern
7. Double top
A double top pattern is formed after a market’s price reaches two highs consecutively with small declines in between. It forms an ‘M’ shape on a chart.
The double top is a bearish reversal pattern, so it’s thought that the asset’s price will fall below the support level that forms at the low point between the two highs. It’s crucial to confirm this support level, as basing your trade solely on the formation of the two peaks can cause a false reading.
In a double top, an upwardly trending market twice tries to hit new highs. But both times, it retraces as sellers drive the price back down – a sign that bullish momentum may be on the wane.
Often, the second top won’t be quite as high as the first, as it’s signalling the end of buying pressure.

8. Double bottom
A double bottom is, perhaps unsurprisingly, the opposite of a double top. It’s formed when a market’s price has made two attempts to break through a support level and failed. In between, there has been a temporary price rise to a level of resistance. It creates a ‘W’ shape.
The double bottom is a bullish reversal pattern because it typically signifies the end of selling pressure and a shift towards an uptrend. Therefore, if the market price breaks through the resistance level, it is likely to continue rising.
As with a double top, it is always worth confirming the resistance level before you open your position. Many traders do this by looking at past price action or using technical indicators.

9. Head and shoulders
The head and shoulders pattern is formed of three highs:
- The central high is the greatest, forming the ‘head’ of the pattern
- It’s flanked by two lower points, which make up the shoulders
All three highs should fall to the same support level – known as the neckline – and while the first two will rebound, the final attempt should break out into a downtrend.
The head and shoulders is a bearish reversal pattern. Like the double top, the market hits a resistance level that it can’t move past. But here, the situation plays out a little differently, hitting a smaller high first, and then with buying momentum clearly falling as the final high doesn’t match the second.

10. Rounded top and bottom
A rounded top or bottom are both reversal patterns. A rounded top appears as an inverted ‘U’ shape, and indicates an imminent downtrend, while a rounded bottom appears as a ‘U’ and occurs before an uptrend.
Again, the price action here is similar to a double top or bottom, but this time it plays out across more sessions than just two.
In a rounded top, the buying sentiment is still gaining ground at the beginning – as evidenced by the higher highs hit by the market. But then, a series of lower highs offers a strong signal that sellers are beginning to take control.
In a rounded bottom, exact opposite happens.

11. Cup and handle
The cup and handle pattern is similar to a rounded bottom, except it has a second, smaller, dip after it. The second smaller curve can resemble a flag pattern if the trend lines are parallel to each other.
You can think of a cup and handle as like a double bottom that’s followed by another smaller double bottom, delaying the beginning of the uptrend but not preventing it.
And like a double bottom, the cup and handle is a bullish reversal pattern.

How to trade with patterns
To trade any of the patterns we’ve highlighted above, you’d generally aim to open a position that earns a profit from the resulting breakout. In a bullish reversal or continuation pattern, you’d buy the market; in a bearish pattern you’d sell.
However, there’s no such thing as an infallible pattern – they can all fail. Because of this, managing risk as you trade a pattern is even more crucial.
There are three steps to managing risk when trading a pattern: confirm the move, place a stop loss and set your profit target.
Confirming a pattern
The easiest way to confirm any pattern is to do nothing whatsoever. Simply wait for one or two sessions, and watch to see whether the price action predicted by the pattern starts to take hold. If it does, you open your trade and only lose out on a few pips of potential profit. If it doesn’t, you’ve avoided taking a loss.
Say you’ve spotted a bullish flag pattern, and the market has broken through its resistance line. Instead of trading instantly, you’d wait a couple of candlesticks. If they’re green, it is more likely that an uptrend has started.
There are other ways of confirming patterns though, and using more than one at once will strengthen your risk management.
If the pattern involves a breakout beyond support or resistance, for example, you can look at past price action or indicators to double check that it’s a significant level. Or you can use momentum indicators to see if a trend looks likely to start.
Setting your stop loss
Even if you’re sure that a trend is about to take off, you’ll want to set a stop loss as you enter your position. It closes your position automatically if it moves against you by a set number of points, helping to ensure that you don’t lose too much.
A good rule of thumb is to set your stop loss at the point at which it is clear that the pattern has failed. Where that is depends on whether you’re trading a bullish or bearish formation.
- In bearish patterns, you might set your stop just beyond the market’s previous high. If it’s hitting new highs, then a downtrend may not be forming
- In bull patterns, it’s the opposite. You can set your stop below the previous significant low
- In our bull flag, for instance, you might set your stop loss close to the pattern’s support line.
Choosing a profit target
The final step is choosing a profit target from your position. Not only does this help you decide where to place your take profit order, but it also enables you to calculate your risk-reward ratio for the opportunity.
Traders will often use the height of the pattern at its outset to give an idea of the size of the following trend. If our bull flag has 50 points between its support and resistance lines, then we might set our take profit 50 points above resistance.
If our stop loss is 25 points below, then we have a 1:2 risk-reward ratio for the position.
Chart patterns summed up
| Name: | Appears after: | Signals: |
|---|---|---|
| Ascending staircase | Any conditions | Nothing |
| Descending staircase | Any conditions | Nothing |
| Ascending triangle | Uptrends | Bullish continuation |
| Descending triangle | Downtrends | Bearish continuation |
| Symmetrical triangle | Uptrends or downtrends | Bullish or bearish continuation |
| Bullish flag | Uptrends | Bullish continuation |
| Bearish flag | Downtrends | Bearish continuation |
| Bullish wedge | Uptrends | Bullish continuation |
| Bearish wedge | Downtrends | Bearish continuation |
| Double top | Uptrends | Bearish reversal |
| Double bottom | Downtrends | Bullish reversal |
| Head and shoulders | Uptrends | Bearish reversal |
| Rounded top | Uptrends | Bearish reversal |
| Rounded bottom | Downtrends | Bullish reversal |
| Cup and handle | Downtrends | Bullish reversal |
Latest market news
Today 11:14 AM
Today 08:28 AM
Yesterday 03:30 PM
Latest Financial market insight articles
March 26, 2024 04:11 AM
November 16, 2023 10:23 AM
November 13, 2023 11:05 AM
October 25, 2023 01:45 PM