November 1, 2022 3:05 PM
When the RBNZ met on October 5th, it hiked rates by 50bps to bring the Official Cash rate to 3.5%. It had debated raising 75bps, but ultimately decided on only a 50bps hike. Since then, New Zealand released its Q3 CPI at 7.2% YoY, down slightly from 7.3% YoY the prior quarter. However, expectations were for a fall to 6.6% YoY. The Employment Data is due out in a few hours for Q3, and it is expected to be +0.5% QoQ vs 0% QoQ last. The RBNZ meets again on November 23rd, and early indications are that the central bank will raise rates by another 50bps to bring the OCR to 4%.
The RBA met earlier today and hiked rates by 25bps, as expected, to bring the cash rate to 2.85%. In addition, it raised its inflation forecast to a peak of 8% this year, vs a previous forecast of 7.75%. Board members see inflation falling to around 4% in 2023 and a little above 3% in 2024. While it continues to expect to raise rates, the size and timing of rate increases will be determined by incoming data. Q3 inflation data released last week showed a rise to 7.3% YoY vs a Q2 reading of 6.1% YoY. Expectations were for a rise to 7.0%.
As a result of the more hawkish RBNZ, AUD/NZD has been moving lower. The pair posted a low of 1.0280 on September 16th, 2021 and had gone bid, ultimately forming an ascending wedge. AUD/NZD posted a false breakout above the wedge and reached a high of 1.1490 on September 28th, 2022. Since then, AUD/NZD has been moving lower, pulling back through the top side of the ascending wedge, and continuing lower through the bottom trendline. The pair has traded aggressively lower over the last 5 days (including today) and has broken through the 38.2% Fibonacci retracement from the lows of September 2021 to the highs of September 2022 at 1.1028 and the 200 Day Moving Average at 1.1003. Price made an intra-day low today thus far at 1.0924.
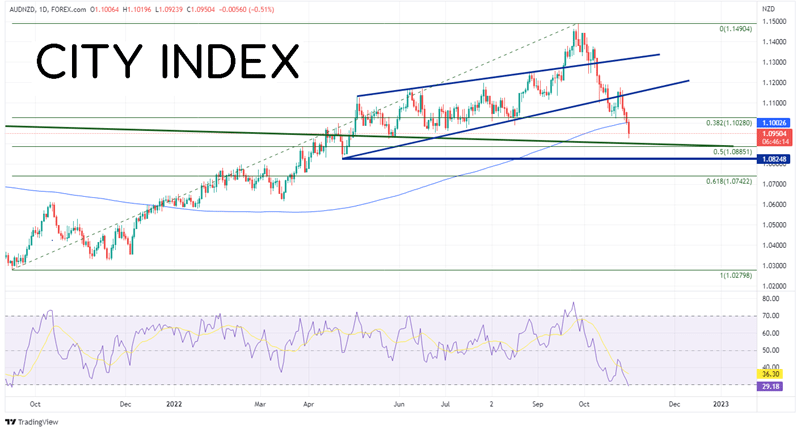
Source: Tradingview, Stone X
Trade AUD/NZD now: Login or Open a new account!
• Open an account in the UK
• Open an account in Australia
• Open an account in Singapore
On a 240-minute timeframe, AUD/NZD has been moving lower in a descending channel. A confluence of support sits right below today’s low at the bottom trendline of the channel, a long-term trendline (green) dating to October 2013, and the 50% retracement from the September 2021 lows to the September 2022 highs between 1.0885 and 1.0915. Below there, price can fall to horizontal support (lows from April 25th) at 1.0825, then the 61.8% Fibonacci retracement level from the previously mentioned timeframe at 1.0742. However, notice that the RSI is in oversold territory, indicating the pair may be ready for a bounce. First resistance is at 200 Day Moving Average and the lows of October 28th between 1.1003 and 1.1014, then the top trendline of the shorter-term channel near 1.1105. Above there, resistance of at the bottom trendline of the ascending wedge (on the daily timeframe) near 1.1144.
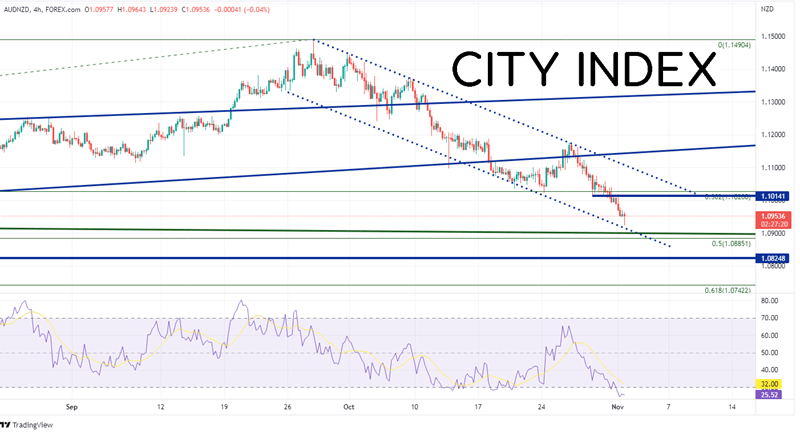
Source: Tradingview, Stone X
With the RBA only hiking rates by 25bps at each of the last two meetings, the RBNZ is the more hawkish of the two central banks. The RBNZ hiked 50bps at its last meeting and is expected to hike another 50bps at its November meeting. Will AUD/NZD continue to move lower. Thus far, it has retraced 38.2% from September 2021 to the September 2022. A bounce may be ahead as the RSI is oversold and there is a confluence of support just below. However, as long as the RBNZ remains hawkish, AUD/NZD may continue to move lower.
Learn more about forex trading opportunities.
Latest market news
Yesterday 01:32 PM
Yesterday 09:35 AM
Yesterday 07:23 AM
Yesterday 04:48 AM
Yesterday 12:17 AM
July 25, 2024 10:39 PM
Latest Trade Ideas articles

Yesterday 09:35 AM

Yesterday 12:17 AM

July 25, 2024 10:39 PM

July 25, 2024 05:30 PM