Has gold bottomed out
Gold’s stronger showing so far has been in response to several things, including a “risk off” trade that was triggered Tuesday afternoon but mainly due […]
Gold’s stronger showing so far has been in response to several things, including a “risk off” trade that was triggered Tuesday afternoon but mainly due […]
Gold’s stronger showing so far has been in response to several things, including a “risk off” trade that was triggered Tuesday afternoon but mainly due a weaker dollar. Indeed, something rather odd happened across the financial markets on Tuesday afternoon. Up until 15:00 GMT it had appeared as if it was “risk on” at the start of the New Year: the UK’s FTSE 100 had broken to a new record high, oil prices had surged to multi-year highs and the EUR/USD had dropped to a new 14-year low. But at around 15:00 GMT, things started to turn around. It was as if someone pressed the “off” button for risky assets across the board: oil went down first, USD/JPY and US indices followed suit while the dollar also weakened. Perceived-safe haven assets like god and yen jumped. While US indices were able to recoup a big chunk of their losses, crude oil remained weak and gold bid. Obviously with many people still away on holiday, liquidity is limited and so price moves can be exaggerated in these types of market conditions. So it remains to be seen whether there are more turns and twists to come before clearer trends are established for this first month of the year. But it is worth noting that as well as the first week of a new year this is also a non-farm payrolls week, in which there tends to be lots of false moves. So, I am not jumping into any conclusions yet when it comes to the dollar and by extension gold.
But there is a possibility that the dollar may have topped out, judging by the price action on the Dollar Index, which created a potential false break out pattern above the 2016 high. If this is the case, then it should be very good news for gold, especially since we are heading out of disinflationary period. Indeed, the CPI measure of inflation in the Eurozone jumped in December to 1.1%, its highest level since September 2013. Inflation in the UK is also running hot and expected to rise further due to sterling’s sharp depreciation. Meanwhile in the US, Donald Trump’s promised fiscal spending could cause prices to rise further in the world’s largest economy. This coupled with a rising price of oil and still very loose global central bank monetary policy stances means there is a risk that global inflation could overshoot.
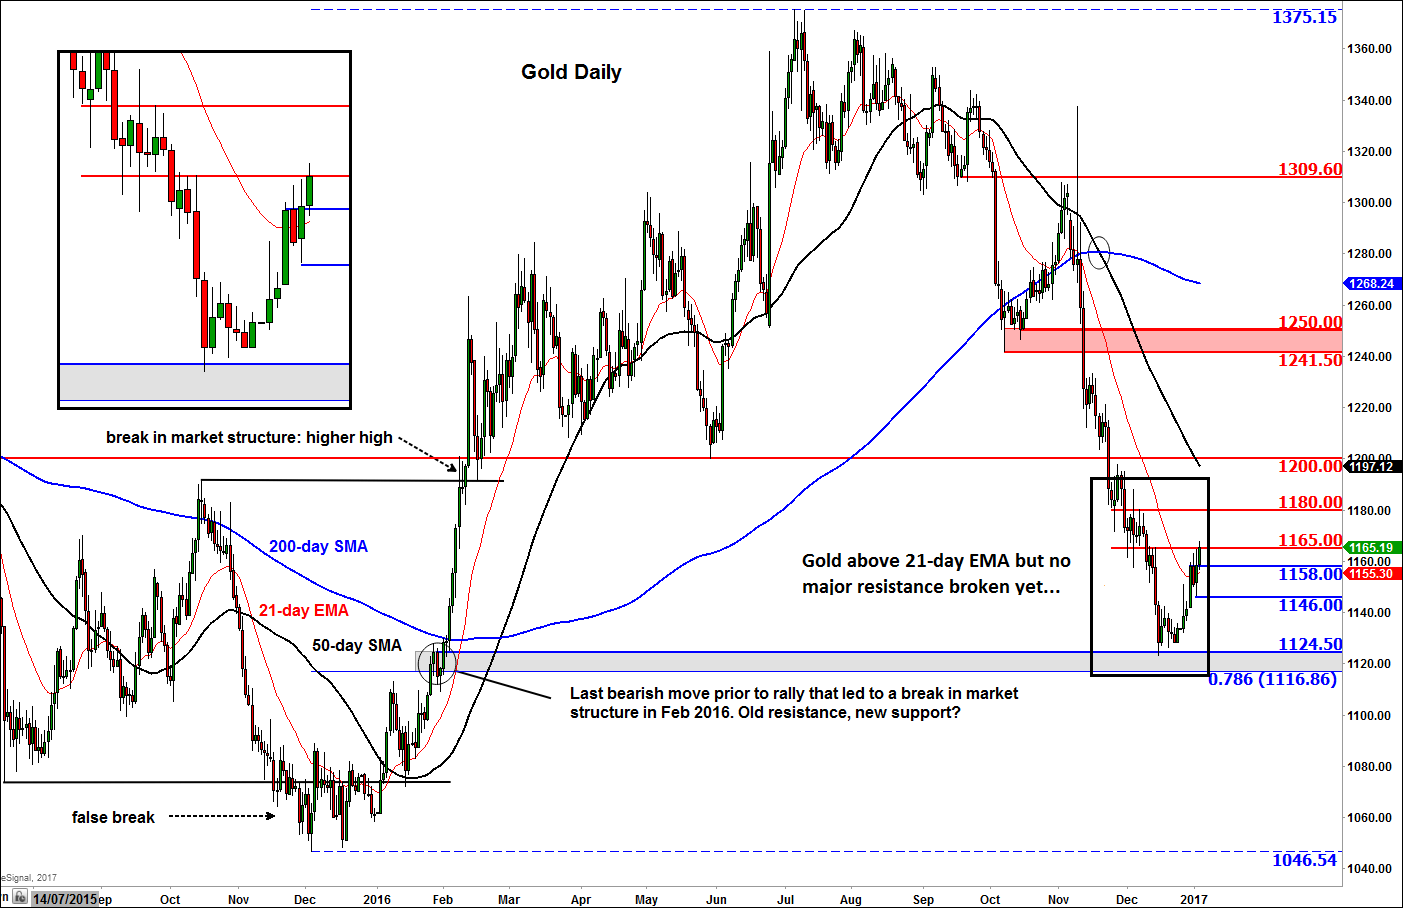
Technical outlook
From a technical perspective, gold’s recent price action has clearly been bullish, although so far no there hasn’t been a decisive break in market structure of lower lows and lower highs. So it is far too early to tell whether it has bottomed out and if it has how high it could go. But it has now risen above the 21-day exponential moving average, which in itself is not necessarily a buy signal but it goes to show that the sellers may be losing control in the short-term outlook. The moving average is also now pointing higher, although the slower-moving 50 and 200 averages both intact and still point lower. So the moving averages tell us objectively that in the short term the trend is bullish but bearish longer term.
It is worth mentioning that gold’s last significant low was formed in a December, of the year 2015, and this current swing low was also formed in a December. If history were to repeat itself, gold could be on the verge of a major up move. Interestingly, the bottom this December has come in around the $1125 area, which was the last point of resistance back at the start of last year prior to the rally that eventually saw gold break the market structure of lower lows and lower highs. Previously resistance, now support: it all makes sense. But this could just have been a short-term bounce rather than the start of a significant rally.
But if it is the start of an upward move then we do need to see a break in market structure of lower lows and lower highs for gold. Well, the last swing high prior to the most recent downward move was at $1165, a level which is being tested today. We need a closing break above this level either today or in the coming days to confirm the turnaround. If seen, gold may then rally towards the next levels of potential resistance or bullish targets at $1180 and $1200 before deciding on its next move. Conversely, if resistance holds at $1165 then the bears will need to see a quick breakdown of support levels at $1158 and ideally $1146, before gold potentially retests $1125 again.