July 21, 2022 10:12 AM
Fresh cycle lows for gold as it printed a low near $1683, a level not seen since August of 2021.
Today’s decline in gold has come after the U.S dollar snapped a three-day losing streak, largely due to a selloff in the EURUSD as Italian political drama forced its way back into the spotlight with the Italian government on the brink of collapse.
The EURO holds a 57% weight in the U.S dollar index, the DXY. When the EURO declines the U.S dollar naturally rises.
Why does the U.S dollar matter for gold?
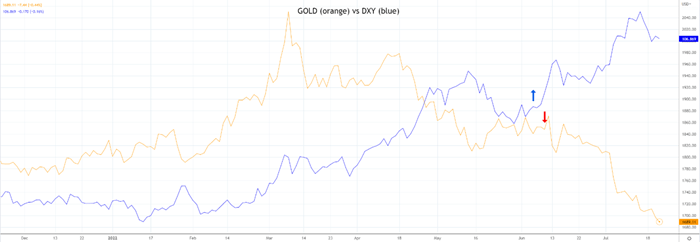
Although the correlation ebbs and flows over time, gold is typically inversely correlated to the U.S dollar. When the U.S dollar rallies, gold generally declines and vice versa.
After a period of positive correlation in March and April, the negative correlation between gold and the U.S dollar reasserted itself and currently sits at -0.56. This explains how the sharp rally in the U.S dollar over the past month has driven gold persistently lower.
What about yields?
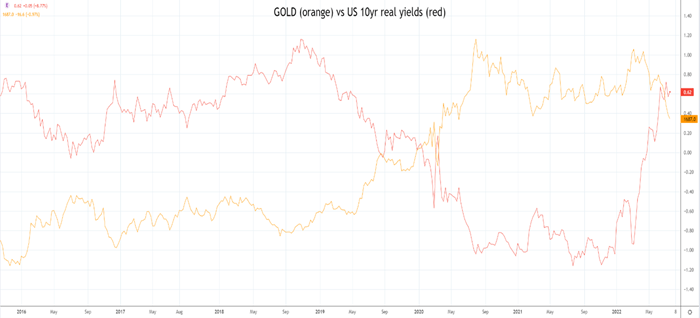
While gold has at times held a negative correlation with real yields that correlation is not currently in play. If it was, gold would be closer to $1000 as viewed on the chart below.
What else do the charts say?
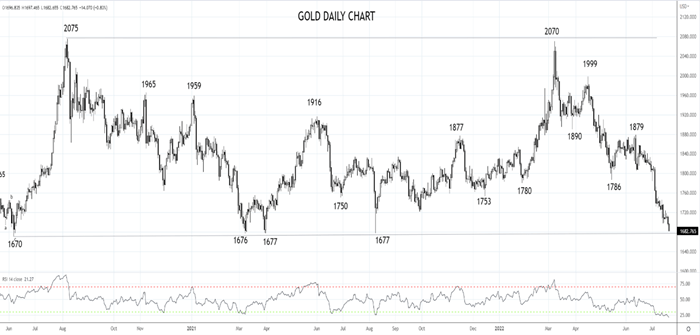
In our last update on gold back in May here, it was noted that “if gold does see a sustained break below $1820ish the risks are for a deeper pullback towards range lows $1700/$1670 into year-end.”
With no sign of a top yet for the U.S dollar, gold looks set to test and break the range lows at $1670 that have held over the past 12 months.
However, like the recent price action in crude oil where it spiked lower to $90 before rebounding promptly back above $100, it could see a similar false break lower, a move that would likely clean out the last of the stale longs.
To formalise, should gold break support at $1670/65 and then rebound back above $1700, I would be quick to resurrect my bullish gold bias looking for $2000 in the medium term.
However should gold see a sustained break below $1670/65 it would open up the next downside levels at $1557 and then $1451.
Source Tradingview. The figures stated are as of July 21 ,2022. Past performance is not a reliable indicator of future performance. This report does not contain and is not to be taken as containing any financial product advice or financial product recommendation
How to trade with City Index
You can trade with City Index by following these four easy steps:
-
Open an account, or log in if you’re already a customer
• Open an account in the UK
• Open an account in Australia
• Open an account in Singapore
- Search for the company you want to trade in our award-winning platform
- Choose your position and size, and your stop and limit levels
- Place the trade
Latest market news
Yesterday 01:32 PM
Yesterday 09:35 AM
Yesterday 07:23 AM
Yesterday 04:48 AM
Yesterday 12:17 AM
July 25, 2024 10:39 PM
Latest Gold articles

July 22, 2024 02:47 AM

July 15, 2024 01:00 AM

July 9, 2024 02:32 AM

July 4, 2024 02:30 PM