

EUR/USD slips with manufacturing data in focus
- Eurozone manufacturing PMI is expected at 43.6 from 44.8
- US ISM manufacturing is expected to rise to 47 from 46.9
- EUR/USD trades below a 2-week falling trendline
EUR/USD has fallen below 1.09 ahead of the European open amid thin volumes and as attention turns towards manufacturing data as the next catalyst.
The euro comes under pressure after data on Friday showed that eurozone inflation cooled by more than expected to 5.5% YoY in June, down from 6.1% in May. However, core inflation ticked higher to 5.4% YoY up from 5.3%. This was still below forecasts of 5.5%.
The market is perfecting the ECB to raise interest rates by 25 basis points at the July meeting. However, the future path of rates beyond July is less clear, with the central bank showing some division as to whether it will raise rates again in September or not. ECB president Christine Lagarde failed to guide for September when she spoke at the ECB annual conference last week.
Meanwhile, the US dollar is rising, supported by a hawkish stance from the Federal Reserve. Speaking at the ECB event, Federal Reserve Chair Powell reiterated that interest rates still needed to rise potentially by a further 50 basis points by the end of the year.
The market is currently pricing in an 85% probability of a 25 basis point hike at the July Federal Reserve meeting. It remained unchanged following Friday’s core PCE data which ticked down to 4.6% but still remains well above the Fed’s 2% target.
Today attention is turning toward manufacturing data. Eurozone manufacturing PMI is expected to confirm that activity contracted at a faster pace in June at 43.6, down from 44.8. Germany is expected to show deep contraction, up 41, down from 43.2 in May.
Meanwhile, US ISM manufacturing is expected to show that activity in the sector contracted at a slower pace of 47, up from 46.9 in June. Attention will also be on the employment, inflation, and new orders sub-components.
US stock markets close at 1pm ET for the Independence Day bank holiday.
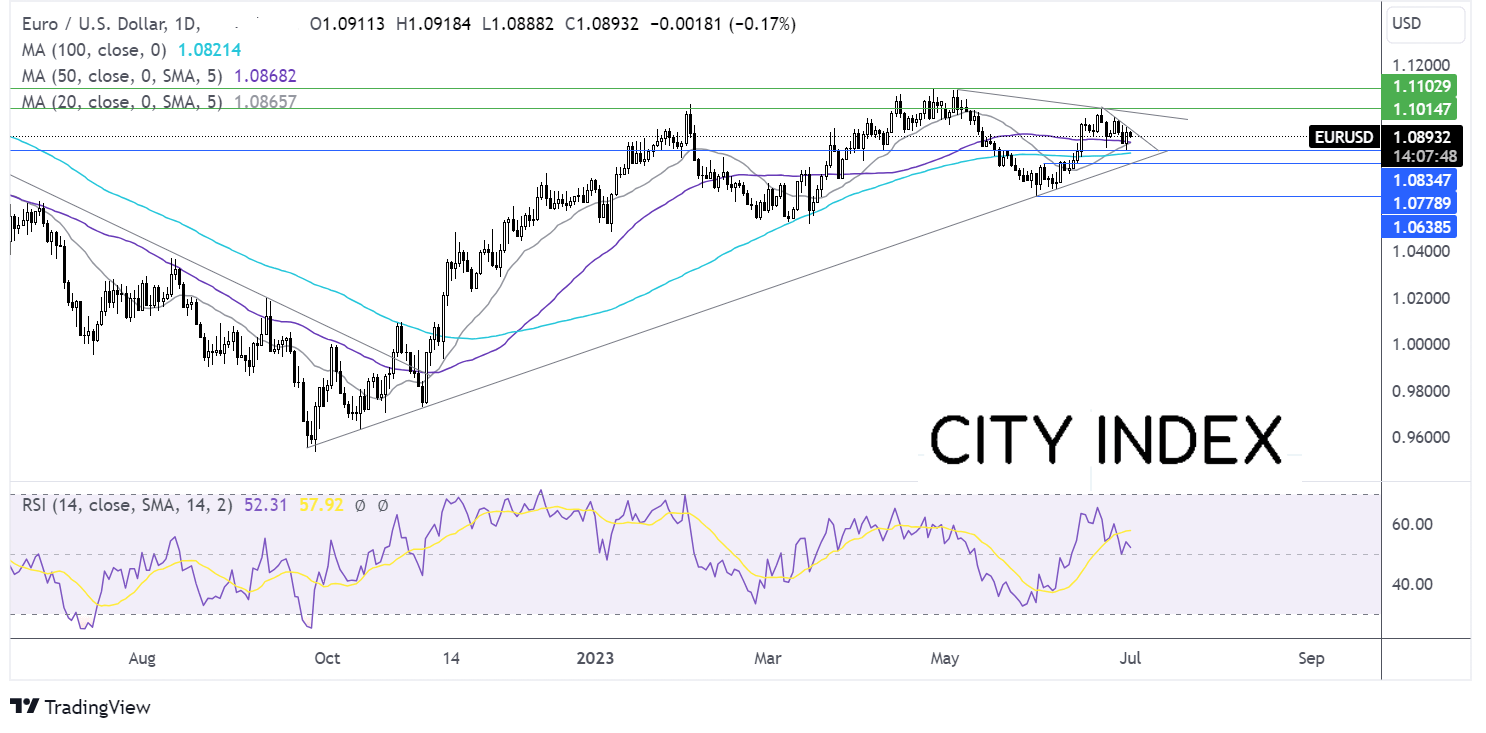
EUR/USD outlook – technical analysis
After running into resistance at 1.1010 on June 22, EUR/USD has been trending lower. The pair trades below a 2-week falling trendline. Sellers will need to take out 1.0870 the confluence of the 50 and 20 sma, to test 1.0835 last week’s low. A break below here is needed to bring 1.0780 the multi-month rising trendline support into play.
Should buyers defend the confluence of the 20 & 50 sma, a rise above 1.0975 last week’s high, is needed, and 1.1010, the June high to create a higher high, putting the bulls back in charge.
Oil edges lower after China data and ahead of OPEC+ meeting this week
- China manufacturing PMI fell to 50.5 from 50.9
- OPEC+ meet this week to discuss output
- Oil falls after 3-days of gains
Oil prices are heading modestly lower after three days of gains as investors digest the latest China PMI data and look ahead to the OPEC meeting on Wednesday.
Chinese manufacturing base search data change in the second quarter grew at a slower pace in June. Define a PMI manufacturing PMI slipped to 50.5, down from 50.9 in May. This was still ahead of forecast 50. The level 50 separate expansion from. The data adds to evidence that the world's second-largest economy and the largest importer of oil lost momentum in the second quarter.
Looking ahead US ISM manufacturing data could influence sentiment today. Weak manufacturing could raise concerns over the health of the US economy, particularly as the Fed looks to raise interest rates twice more before the end of the year.
OPEC will meet this week to discuss oil production levels. The group is not expected to change output. In the June meeting, Saudi Arabia unexpectedly cut its oil output by 1 million barrels per day.
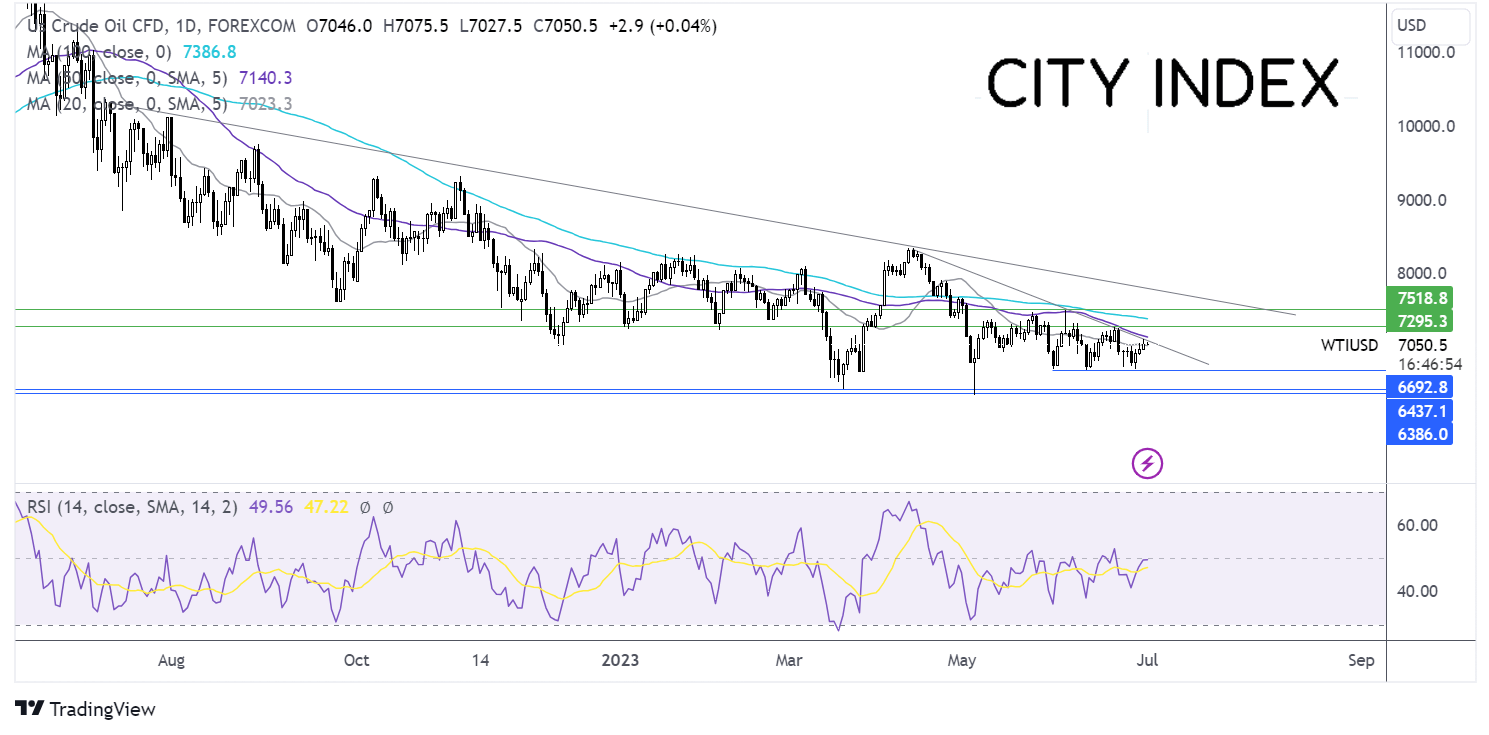
Oil outlook – technical analysis
After 3-days of gains, which saw WTI oil reclaim 70.00 last week, the price is falling. The prices once again ran into resistance at the 50 sma and falling trendline resistance at 71.08.
Sellers will look for a fall below 67.00, a level which has offered support on several occasions since the end of May. A break below here opens the door to 63.60 the May low.
Meanwhile, buyers will look for a rise above 71.40 the 50 sma and falling trendline resistance. Above here 72.70 the June 21 high comes into target, before exposing the 100 sma at 74.10. A rise above 75.07 the June high creates a higher high.
Latest market news
Yesterday 01:32 PM
Yesterday 09:35 AM
Yesterday 07:23 AM
Yesterday 04:48 AM
Yesterday 12:17 AM
July 25, 2024 10:39 PM
Latest Trade Ideas articles

Yesterday 09:35 AM

Yesterday 12:17 AM

July 25, 2024 10:39 PM

July 25, 2024 05:30 PM