
Asian Indices:
- Australia's ASX 200 index rose by 80.5 points (1.06%) and currently trades at 7,680.70
- Japan's Nikkei 225 index has risen by 31.01 points (0.09%) and currently trades at 36,096.87
- Hong Kong's Hang Seng index has fallen by -191.82 points (-1.22%) and currently trades at 15,511.63
- China's A50 Index has risen by 28.74 points (0.26%) and currently trades at 11,089.05
UK and European indices:
- UK's FTSE 100 futures are currently up 7.5 points (0.1%), the cash market is currently estimated to open at 7,673.81
- Euro STOXX 50 futures are currently down -2 points (-0.04%), the cash market is currently estimated to open at 4,660.70
- Germany's DAX futures are currently down -9 points (-0.05%), the cash market is currently estimated to open at 16,963.34
US index futures:
- DJI futures are currently up 23 points (0.06%)
- S&P 500 futures are currently down -18.5 points (-0.37%)
- Nasdaq 100 futures are currently down -136.25 points (-0.77%)

Events in focus (GMT):
- 18:00 – German retail sales, import/export price indices
- 18:45 – French CPI
- 19:55 – German unemployment
- 20:00 – German state CPIs
- 00:15 – US ADP employment change
- 00:30 – US employment cost index
- 00:30 – Canadian GDP
- 06:00 – FOMC interest rate decision, statement
- 06:30 – FOMC press conference
A much-welcomed set of soft CPI figures has brought forward expectations for the RBA's first cut to arrive as early as May. The ASX 200 reached a record high with financial and energy stocks leading the way.
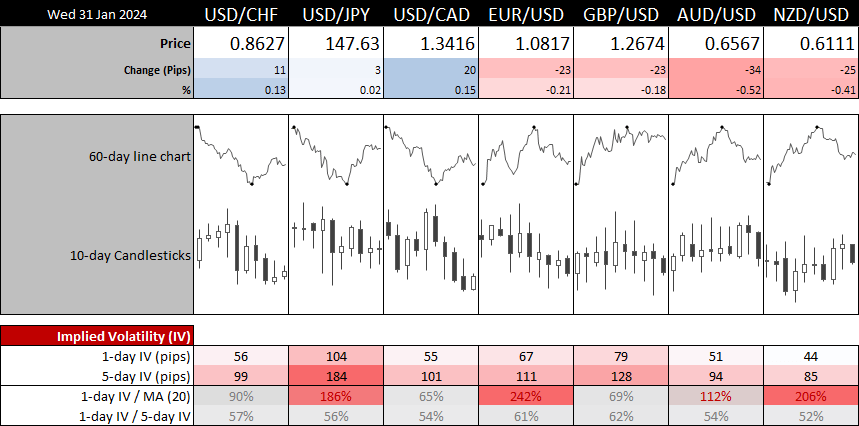
It's practically a given that the Fed will hold rates today, so traders want to hear solid clues that they may cut rates in H1. But if recent Fed comments are anything to go by, they're unlikely to signal any future cuts today. And that leaves upside potential for the US dollar and yields, to the detriment of AUD/USD.
The 1-day implied volatility level for EUR/USD has risen to an impressive 242% of its 20-day average, with USD/JPY traders also expecting volatility for USD/JPY with an IV level of 186% of its 20-day MA.
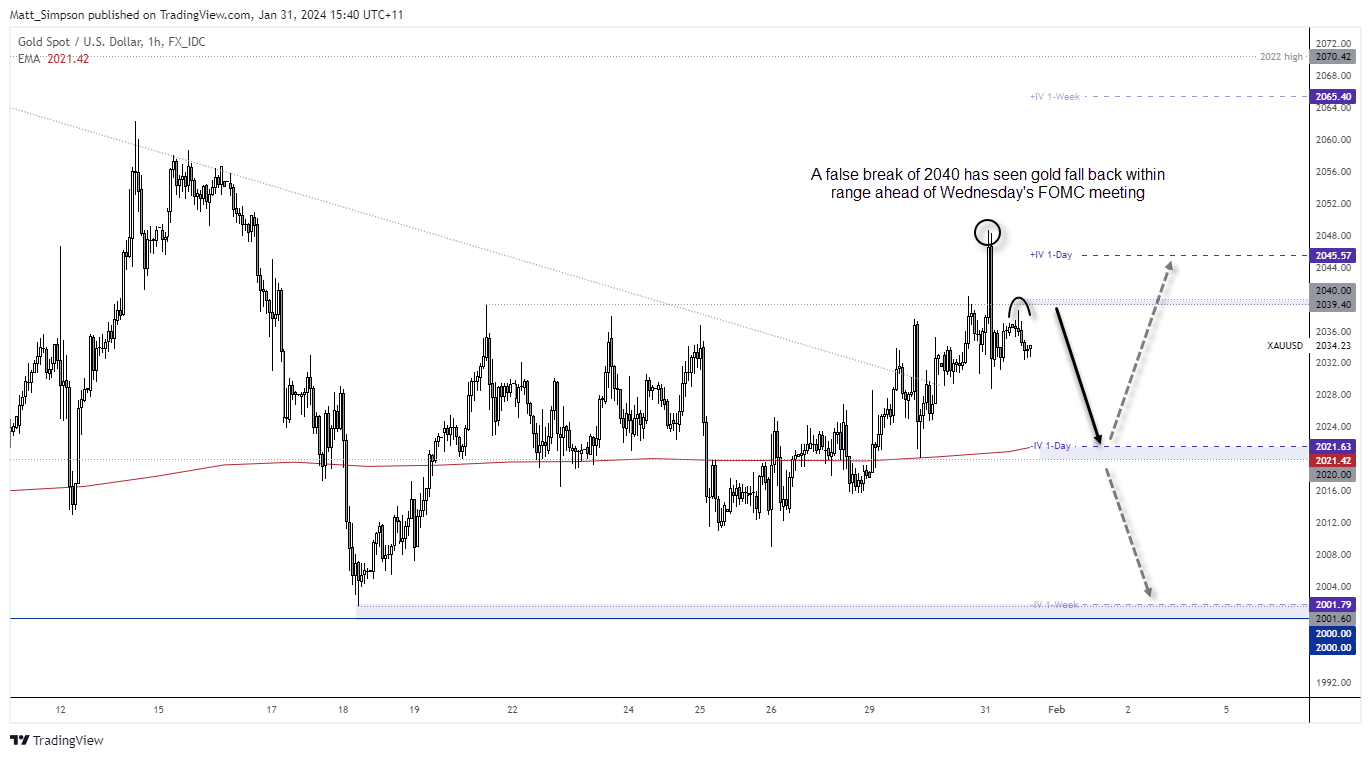
Gold technical analysis (1-hour chart):
The daily chart of spot gold produced a shooting star candle on Tuesday, and that it closed back beneath 2039.40 resistance warns of supply above 2040 and for a potential pullback. It would likely require a very hawkish Fed meeting to drive gold materially lower, and as I’m running on the assumption it won’t be as dovish as hoped then it leaves room for a retracement lower before its next leg higher.
The 1-hour chart shows a strong reversal around 2048 before prices crashed back below 2039.40. The Asian high tried but failed to retest 2039.40, so my bias for today is bearish. Bears could seek to fade into moves below 2040 with a stop above Tuesday’s high or 2050, with an initial target around 2020.
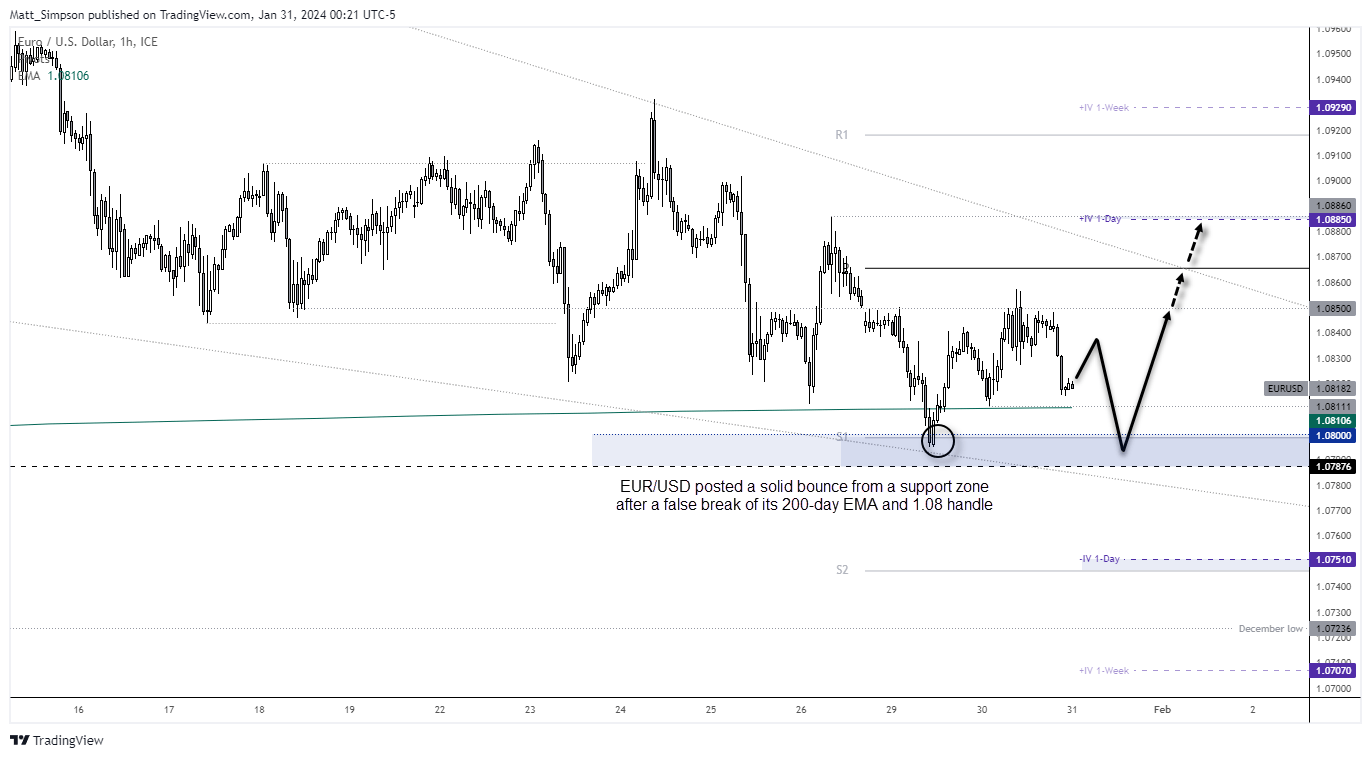
EUR/USD technical analysis (1-hour chart):
A surge of US dollar strength saw the EUR/USD dragged lower during an unusually lively Asian session for the pair. Yet prices are now showing signs of stability above some big support levels. EUR/USD manage to rebound following a false break of the 200-day EMA and 1.08 handle on Monday, and we may find history repeat if bears try to drive it lower again.
A retracement higher against Asia’s losses seems plausible, but if we’re treated to another dip beneath the 200-day EMA my bias is for it to rally back above it again. 1.0850 is an initial target, a break of which brings the weekly pivot around 1.0865 into focus.
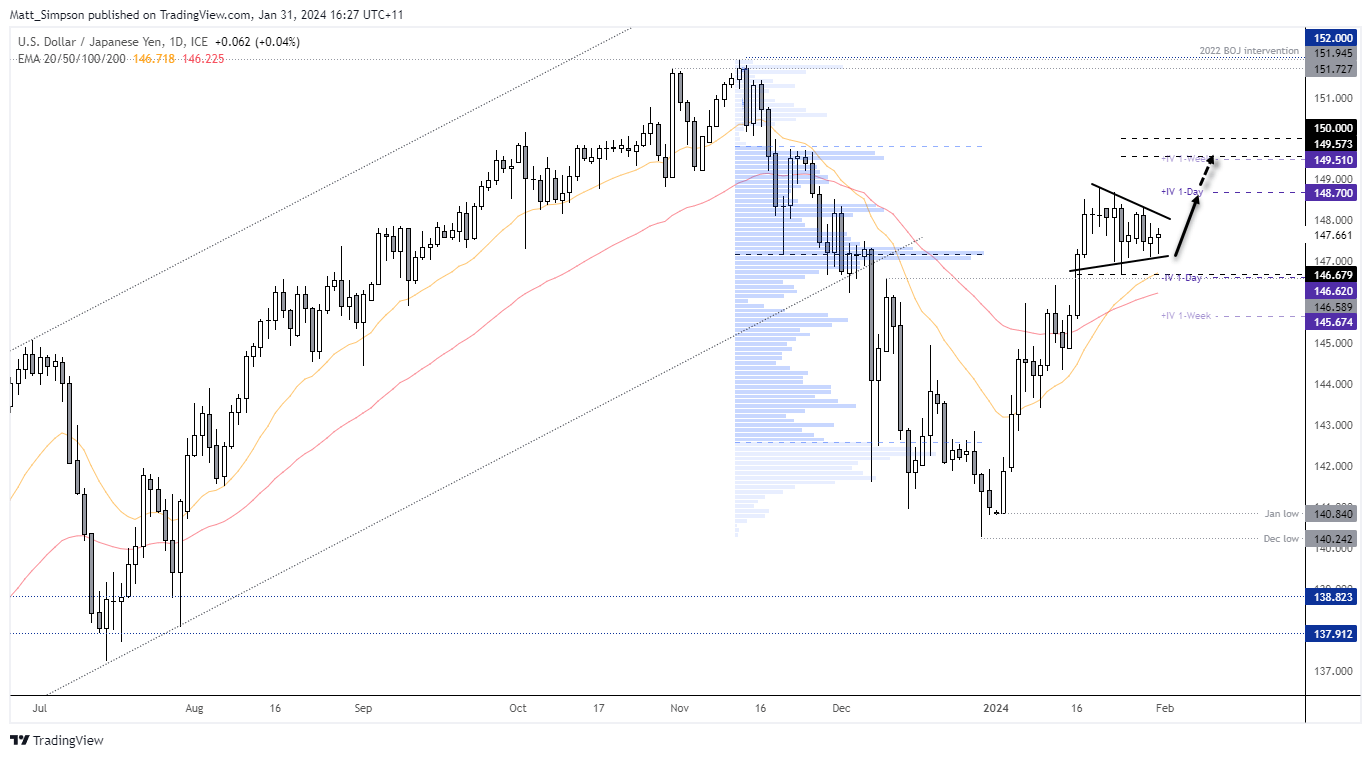
USD/JPY technical analysis (daily chart):
I have covered USD/JPY a couple of time this week already, and not much has changed; it remains within a consolidation period on the daily timeframe and the bias is for a bullish breakout. We should be on guard for the usual bout of volatility before its intended direction unfolds, but I’d prefer to seek dips above 146 with am initial target near the cycle highs / +IV 1-day and the resistance zone around 150.
View the full economic calendar
-- Written by Matt Simpson
Follow Matt on Twitter @cLeverEdge
How to trade with City Index
You can trade with City Index by following these four easy steps:
-
Open an account, or log in if you’re already a customer
• Open an account in the UK
• Open an account in Australia
• Open an account in Singapore
- Search for the market you want to trade in our award-winning platform
- Choose your position and size, and your stop and limit levels
- Place the trade
Latest market news
Yesterday 01:03 PM
Yesterday 12:52 PM
Yesterday 12:11 PM
Yesterday 07:49 AM
Latest Trade Ideas articles


Yesterday 07:49 AM

Yesterday 07:01 AM