EUR USD The sun may be setting on the Q3 bounce
Plenty of ink has been spilled about ECB President Mario Draghi’s dovishness last week, especially in contrast to the more-hawkish-than-expected Federal Reserve meeting. Given the […]
Plenty of ink has been spilled about ECB President Mario Draghi’s dovishness last week, especially in contrast to the more-hawkish-than-expected Federal Reserve meeting. Given the […]
Plenty of ink has been spilled about ECB President Mario Draghi’s dovishness last week, especially in contrast to the more-hawkish-than-expected Federal Reserve meeting. Given the big fundamental shift over the last two weeks, we thought it would be worthwhile to check in on the pair’s longer-term technical outlook.
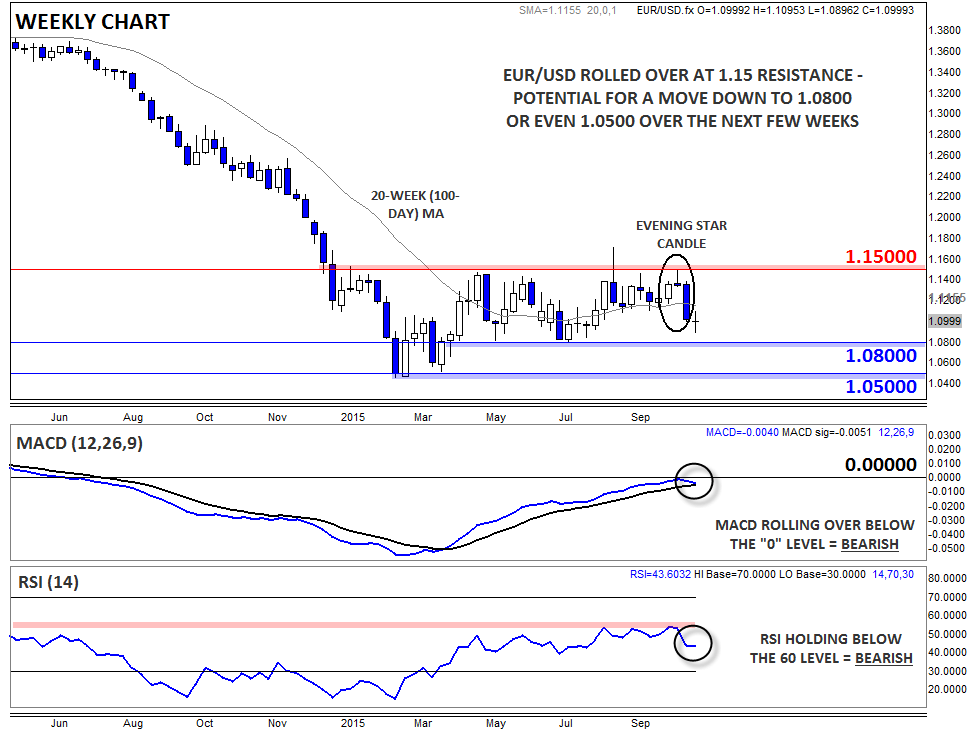
Looking at the weekly chart reveals a mixed picture for EUR/USD. The unit is undoubtedly in a long-term downtrend since peaking near 1.40 midway through last year, though rates have been generally rangebound between 1.05 and 1.15 for most of this year. Looking at the last six months specifically, the range has been even tighter from 1.0800-1.1500.
After testing resistance at 1.1500 in mid-October, the pair formed a clear Evening Star* candlestick pattern. This relatively rare 3-candle reversal pattern shows a gradual shift from buying to neutral to selling pressure and is often seen at important tops in the market. While we haven’t seen much continuation to the downside this week, with price merely forming a weekly Doji candle**, the technical outlook is still bearish below the 20-week (100-day) MA near 1.1200.
Meanwhile, the secondary indicators are also pointing lower. The MACD is rolling over beneath the “0” level and about to cross back below its signal line, signaling the return of bearish momentum. For its part, the RSI indicator remains pinned below the 60 level that typically serves as resistance within an established downtrend.
At this point, medium-term bears should be eyeing the 1.0800 level as the next major level to watch. Buyers could certainly step in to defend that level, as they did in May and July, but if it gives way, a continuation down to the 13-year low around 1.0500 could be next. Based on the weekly chart, it’s hard to have a bullish long-term outlook on EUR/USD as long as rates are pinned below 1.1500 resistance.
* An Evening Star candle formation is relatively rare candlestick formation created by a long bullish candle, followed a small-bodied candle near the top of the first candle, and completed by a long-bodied bearish candle. It represents a transition from bullish to bearish momentum and foreshadows more weakness to come.
**A Doji candle is formed when rates trade higher and lower within a given timeframe, but close in the middle of the range, near the open. Dojis suggest indecision in the market.