


Stock chart patterns can help give you the edge on the equities markets, providing useful insight into when to join a trend – or when to watch for a reversal. Read your complete guide to stock chart patterns here.
- What are stock chart patterns
- How to read stock chart patterns
- 12 patterns every stock trader should know
What are stock chart patterns?
Stock chart patterns are recognisable motifs that appear on the charts of equities markets. Technical shares traders use them to predict where a company’s stock might be headed next in the short to medium term – making them popular among day traders, or investors trying to find the best level to open or close their position.
Just like any other type of Japanese candlestick pattern, the theory behind stock chart patterns is that if a particular piece of price action has regularly led to the same outcome in the past, it should do so again in the future.
How to read stock chart patterns
To read stock chart patterns, you scan a market’s chart to see if it forms one of the motifs we set out below. Then, you confirm that it matches the rules of the specific pattern and check what price action should happen next.
Once you’ve followed these steps, you should be ready to consider whether to open your trade. Before you buy or sell your chosen stock, though, we’d always recommend confirming that the trend signalled by the pattern is actually underway.
Confirming stock chart patterns
The simplest way to confirm a stock chart pattern is to just wait for a couple of sessions so you can see whether the predicted trend is forming before you open your position. However, some traders use patterns alongside other tools and indicators such as the RSI or Bollinger Bands. If the indicator also signals that a trend is underway, then the signal is stronger.
Of course, even a confirmed trend can still reverse, which is why you should set a stop loss and profit target on any pattern trade. Some stock chart patterns come with built-in areas for risk management – we’ll outline some of these below.
How to trade stock patterns
To trade a stock chart pattern, you open a position once the pattern completes, to take advantage of the market’s next predicted move.
To start trading them with City Index, follow these steps:
- Open your City Index trading account
- Log in to our award-winning online trading platform, download our mobile trading apps or access third-party tools including MT4 and TradingView
- Start looking for chart patterns across 1,000s of financial markets
- Open your position
Or you might want to get started on a risk-free demo trading account, which enables you to try out buying and selling without putting up any of your own capital.
12 stock chart patterns every trader should know
There are countless stock chart patterns you can employ in your technical analysis, but here we’ve concentrated on 12 examples of popular patterns across four different categories.
- Doji
- Spinning top
- Hammer
- Triangle
- Flag
- Wedge
- Rounded top and bottom
- Double top and bottom
- Head and shoulders
- ABCD
- Gartley
- Shark
Candlestick stock chart patterns
Candlestick patterns appear over one or more sessions, making them useful for predicting immediate price action. They can signal reversals (meaning a trend is about to end, with the opposite sentiment taking over) or continuations (meaning the existing trend will proceed further) depending on the pattern and the context it sits in.
1. Doji pattern
One of the easiest candlestick patterns to spot, a doji occurs when a session’s opening and closing prices are exactly the same (or almost exactly the same). This means that the candle for the session has almost no body whatsoever.
If Apple began the day at 177 and ended at 178, then that day’s candlestick would be a doji.
There are four main types of doji, depending on the appearance of the upper and lower wicks:
- Four-legged doji have long wicks on either side, meaning the stock saw high highs and low lows but ended the period where it started
- Four-price doji have no wicks on either side, indicating very little volatility
- Dragonfly doji have a long upper wick and no lower wick – so bulls sent the price high, but bears beat it back down
- Gravestone doji have a long lower wick and no upper wick. Here, bears sent the price down before bulls took over
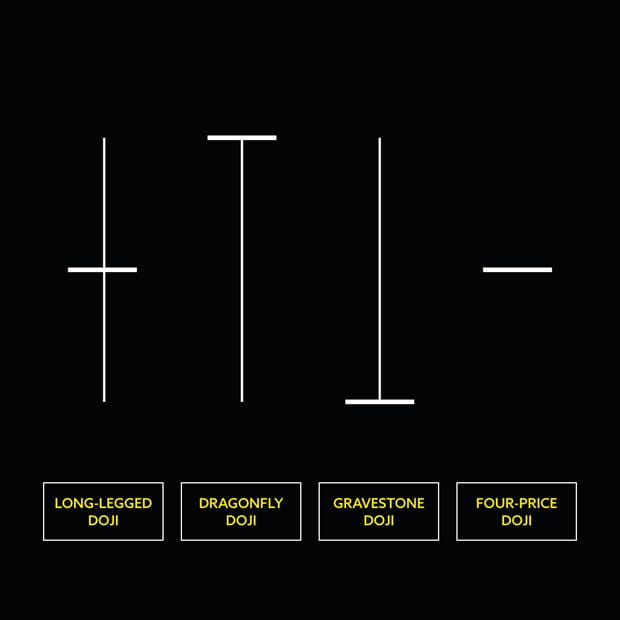
Doji can mean many things, but generally they are a sign of indecision among buyers and sellers – neither side has the upper hand.
2. Spinning top pattern
A spinning top looks similar to a four-legged doji, but with a slightly wider body. So the stock saw serious volatility within the session, with buyers and sellers swapping superiority – but neither was able to take full control.
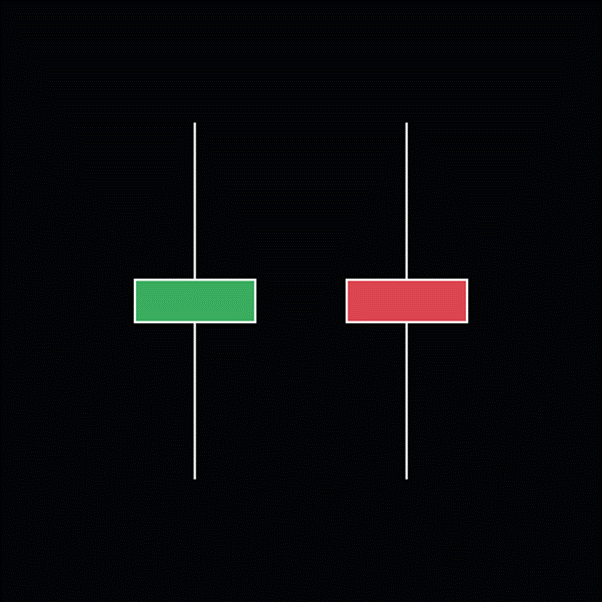
However, unlike the doji, there is some difference between the share’s opening and closing price. In a bullish green spinning top, the market moved up; in a bearish spinning top it moved down.
Either variant of spinning top indicates split sentiment, just like a doji. So, if you spot one on a strongly trending market, it may be a sign that the trend is about to reverse.
3. Hammer pattern
Our final single-candlestick pattern is the hammer, which has a long lower wick and a short body (not as short as a doji or spinning top, though). To check that you have spotted a hammer, compare the length of the wick to the body: it should be around three times as long.
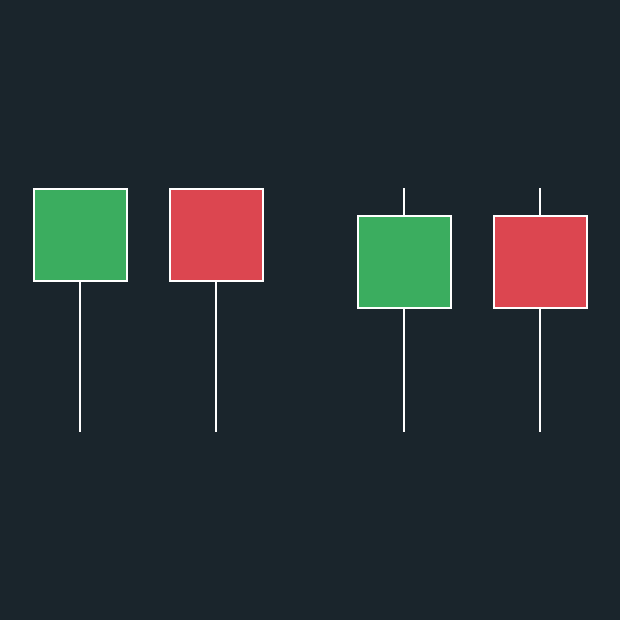
Hammers appear on bear markets and indicate an impending bullish reversal – meaning the downtrend is coming to an end, with an uptrend about to take over. However, there are other similar patterns that can signal different things:
- The hanging man pattern looks exactly like a hammer, but appears on uptrends and signals a bearish reversal instead
- The inverted hammer looks like an upside-down hammer, with a long upper wick instead of a lower one. Like the hammer, it indicates a possible impending bullish reversal
- Finally, the shooting star looks exactly like an inverse hammer – but like the hanging man, it appears on bull markets and signals a bearish reversal
Continuation stock chart patterns
Continuation stock chart patterns take place over longer periods and signal that a trend is about to resume. They can offer a useful opportunity to hop onto an ongoing rally.
Each of the continuation stock chart patterns we’re going to cover here forms as a period of consolidation, breaking up an existing trend. Then, a breakout through support or resistance signals that the original trend is about to continue.
1. Triangle pattern
In a triangle pattern, the trending market begins to consolidate between support and resistance lines. One of the lines points up or down, while the other remains horizontal – giving the pattern its triangle shape.
- In an ascending triangle, the resistance line is horizontal and the support line points up. This pattern gives a bullish continuation signal when it appears on uptrends
- In a descending triangle, the support line is horizontal and the resistance line points down. This pattern gives a bearish continuation signal when it appears on downtrends

In either variation of the triangle pattern, the prevailing trend hits a blockage.
In a descending triangle, for example, sellers are unable to push the market’s price further and instead keep hitting the support line. However, a countertrend doesn’t form either. And each attempt to start a bullish reversal peters out sooner than the last, hence the sloping resistance line.
As the pattern narrows, watch for a breakout in the direction of the preceding trend. However, a breakout in the opposite direction may indicate that a new countertrend is forming.
Traders often use the width of the triangle to plot a profit target from the resulting trade and place a stop loss just beyond the sloping line.
2. Flag pattern
Like a triangle, the flag pattern arises when a market that was in a trend hits a point of consolidation between support and resistance lines. However, in a flag both lines slope, running parallel to each other.
Flags also come in bullish and bearish variants:
- In a bullish flag, both lines point downwards. This pattern gives a bullish continuation signal when it appears on uptrends
- In a bearish flag, both lines point upwards. This pattern gives a bearish continuation signal when it appears on downtrends
In a flag, a countertrend begins to take hold after a sustained move up or down. However, there isn’t enough momentum to form a reversal, and price remains stuck between support and resistance. If we see a breakout in the direction of the original trend, then the pattern completes and the trend resumes.

Once again, you can measure the distance between the support and resistance lines for an initial profit target – and set your stop loss beyond the opposite support or resistance line.
3. Wedge pattern
Finally, let’s cover the wedge pattern. Wedges work almost exactly like flags, with the key difference that the support and resistance lines don’t run parallel. Instead, they point towards each other.
As with flags, there are bullish and bearish types of wedges, with bullish wedges pointing down and bearish ones pointing up.

With any continuation pattern, it can be useful to watch for falling volume as a measure of the strength of the signal. After all, the market is consolidating within the pattern, which is usually accompanied by lower trading activity. Then, when the breakout starts, volume should spike.
Reversal stock chart patterns
Reversal stock chart patterns take hold over the medium to long term, just like continuation ones. However, they signal the opposite price action. When you see one of these patterns on a trend, it means the prevailing price momentum could be about to switch.
1. Rounded top and bottom pattern
The round top and bottom are two patterns that give bearish and bullish signals respectively. In both, the market steadily changes from the previous trend into the opposite, giving a rounded ‘U’ shape on the chart.

Once the market returns to –then breaks through – the support or resistance line that kicked off the pattern, the rounded top or bottom is complete and a new trend should form.
As with some of the patterns we’ve already covered, the height of the rounded top or bottom can give a useful profit target.
2. Double top and bottom pattern
Again, the double top and bottom are two separate reversal patterns. One gives a bullish signal, the other bearish.
- The double top is a bearish pattern. It appears when a stock in an uptrend hits a resistance level twice with a retracement in the middle, giving an ‘M’ shape
- The double bottom is a bullish pattern. Here, a stock hits support twice, giving a ‘W’ shape
The price action in a double top or bottom is fairly clear. Traders try to continue a trend on two occasions but are unable to – a sign of waning momentum. After the second failure, momentum fully switches and a countertrend forms.

With a double top or bottom, the distance of the retracement can give an initial profit target.
3. Head and shoulders pattern
You can think of a head and shoulders pattern as a double top with an extra, bigger drive upwards in the middle of it. This gives the market three peaks:
- The first is a lower peak with a retracement to support after it
- The second is a new drive towards a new, higher resistance line, followed by a retracement back to the same support line
- The third matches the height of the first, and here the retracement should break support

Despite repeated attempts to continue the uptrend, buying sentiment has clearly stalled by the third peak, indicating that a downtrend may be about to form.
Harmonic stock chart patterns
Finally, let’s examine a few harmonic stock chart patterns. These are advanced patterns that are based on Fibonacci theory, so if you’re getting started out with stock technical analysis, you might want to hold off on these for now.
1. ABCD pattern
Instead of forming shapes, most harmonic patterns consist of a set of distinct moves with and against the prevailing trend. The ABCD is a classic example of these moves.
It can form in either bullish or bearish variants. In a bullish ABCD, the first move is downward, from point A to point B. Then BC is upward, CD is downward and the market reverses at D. A bearish ABCD is the opposite.
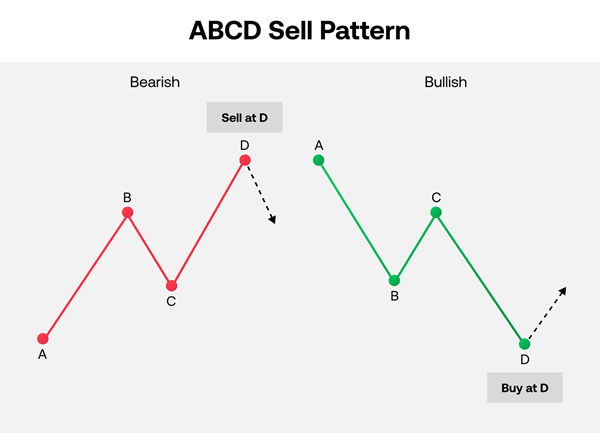
However, to identify an ABCD you need to pay attention to the relationship between the different moves. For instance, AB and CD should be equal in length, BC should be a Fibonacci retracement of AB and CD should be a 127.2% or 161.8% retracement of BC.
Read the full rules of the ABCD pattern.
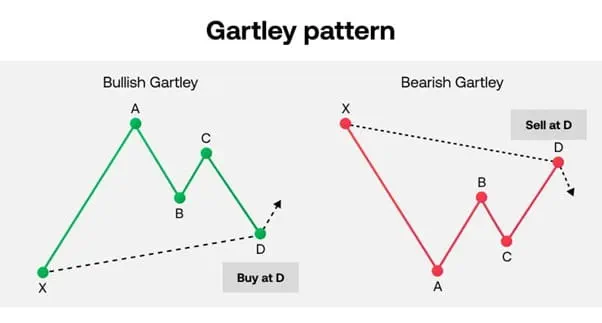
2. Gartley pattern
The Gartley pattern is like the ABCD but has an extra move in front of it, usually labelled as ‘XA’. It is a continuation pattern, with an initial major move from X to A resuming after point D.
As with an ABCD, Gartleys can be bullish or bearish depending on the direction of the initial move.
- If XA points up, you have a bullish Gartley
- If XA points down, you have a bearish Gartley
And, once again, there are specific rules about each of the moves within. Read the full rules of the Gartley pattern.
3. Shark pattern
We’ve seen ABCD and XABCD used in harmonic patterns. The shark adds another move to make an OXABCD. However, while point D is used as a ‘potential reversal zone’ (PRZ) in ABCD and Gartley patterns – meaning an area to open your trade – in a shark, D is your profit target.
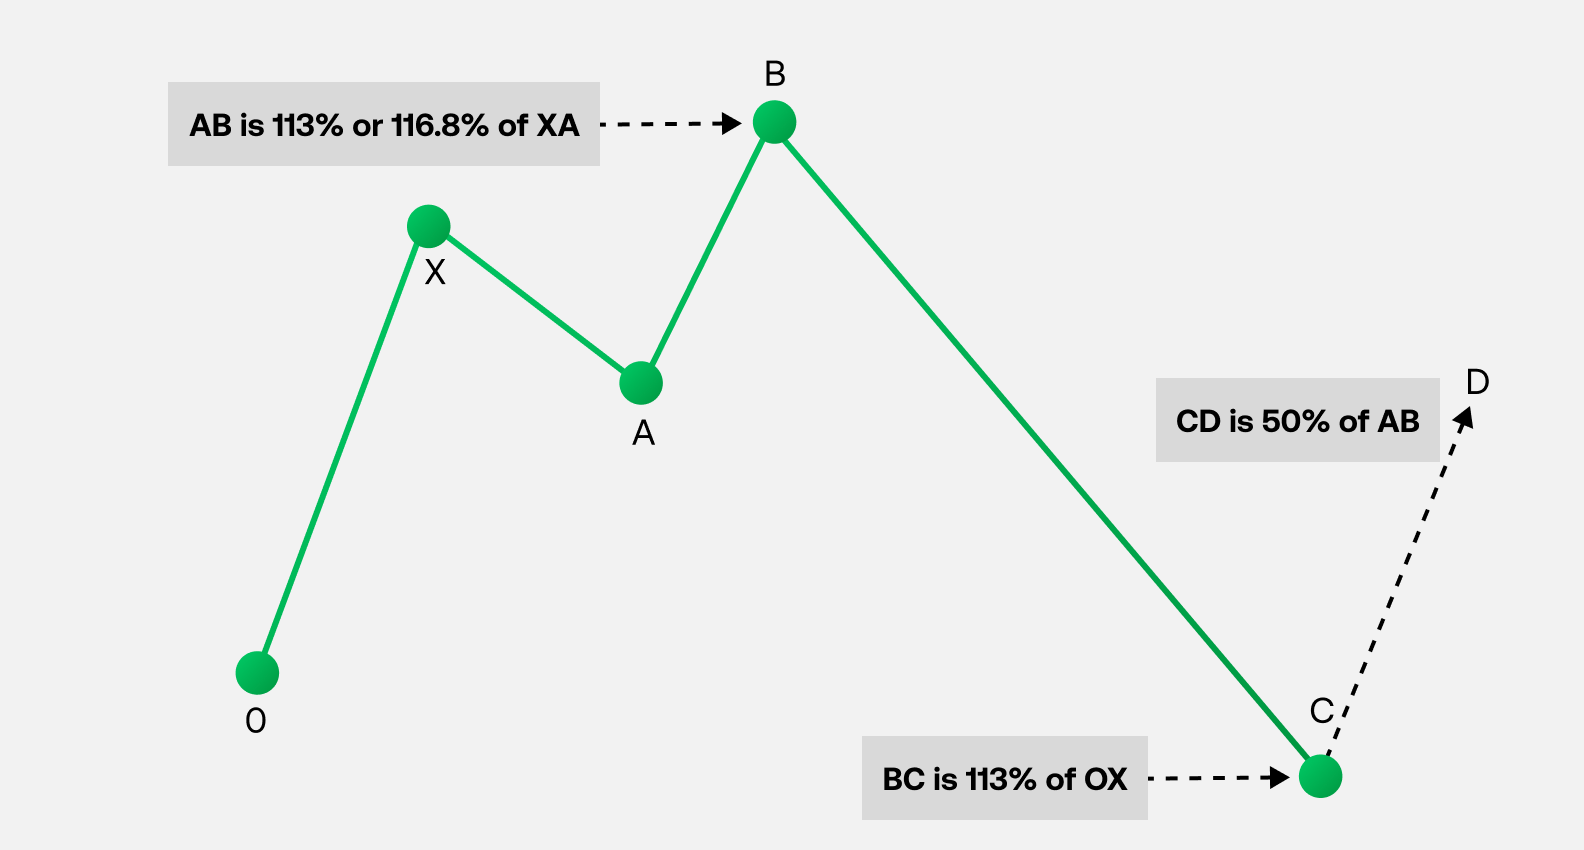
As with other harmonics, the shark can be bullish or bearish, depending on the first move (in this case, OX). If OX points up you have a bullish shark pattern, if it points down you have a bearish shark. You’ll also have to watch for specific Fibonacci retracements to confirm that you actually have a shark pattern.
You can see the rules for a shark pattern here.
Latest market news
Yesterday 01:23 PM
Yesterday 06:01 AM
April 18, 2024 11:27 PM
April 18, 2024 04:46 PM
Latest Financial market insight articles
March 26, 2024 04:11 AM
November 13, 2023 11:05 AM
October 25, 2023 01:45 PM
October 25, 2023 07:48 AM