November 19, 2022 3:12 PM

Inflation in Canada is still high despite the Bank of Canada “only” hiking 50bps at its last meeting, rather than the 75bps that the markets expected (though the BOC did note that it would continue raising rates to combat inflation). On Friday, Canada released its PPI data for October. The headline print was 10.1% YoY vs an expectation of only 7.8% YoY and a September reading of 9.1% YoY. This was this first increase in the print after six consecutive declines. Not only did the inflation indicator rise more than expected, but it was also much higher than the previous month! In addition, Raw Materials Prices for Canada in October rose 1.3% MoM vs an expectation of -0.4% MoM and a September reading of -3.1% MoM. This data follows Wednesday’s CPI release which showed that the level of inflation remained unchanged from the previous month at 6.9% YoY. However, the Core CPI rate fell from 6% YoY to 5.8% YoY.
Like many of the US Dollar pairs, USD/CAD had been rising since the spring of 2022. On October 13th, the pair made a high of 1.3978 and began pulling back. Note that is the same day that the S&P 500 bottomed at 3502. USD/CAD then began moving lower as the S&P 500 began moving higher and eventually formed a head and shoulders pattern. The pair convincingly broke the neckline of the pattern on November 10th and moved to horizontal support at 1.3224. The target for a head and shoulders pattern is the distance from the head to the neckline, added to the breakdown point. In this case the neckline is near 1.3050.
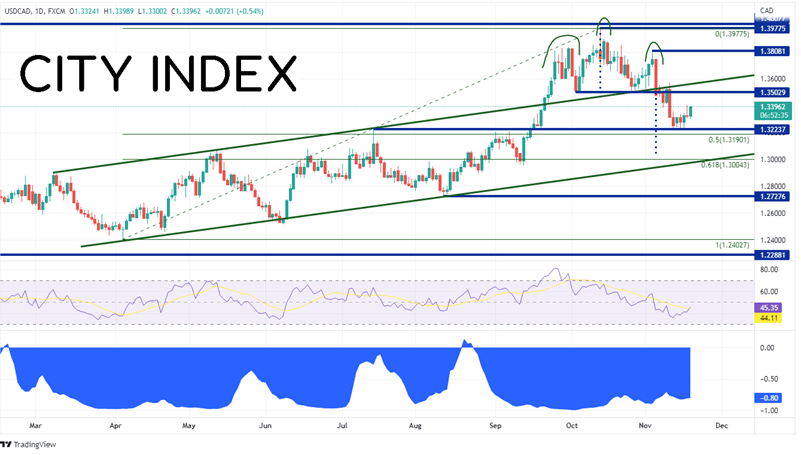
Source: Tradingview, Stone X
However, notice the correlation coefficient between USD/CAD and the S&P 500 at the bottom panel of the chart. USD/CAD has a strong negative correlation with the S&P 500. This means that when the large stock index moves in one direction, there is a good chance that USD/CAD will move in the opposite direction. The current correlation coefficient is -0.80. A reading at or below -0.80 is considered strong. Therefore, the direction of USD/CAD seems to depend more on the direction of the S&P 500 than it does on the underlying inflation data from Canada.
Trade USD/CAD now: Login or Open a new account!
• Open an account in the UK
• Open an account in Australia
• Open an account in Singapore
On a 240-minute timeframe, there is a good deal of resistance between 1.3465 and 1.3571. First resistance is at the lows from November 7th at 1.3465. Above there, resistance is at the neckline of the head and shoulders pattern at 1.3503. The next level of resistance is a confluence of resistance at the highs from November 19th and top upwards sloping trendline of the longer-term channel (green) near 1.3571. However, if the pair continues to move lower towards the head and shoulders target, the first support is at the highs of July 14th and the lows from November 22nd at 1.3224. Just below there, support is at the 50% retracement level from the lows of April 5th to the highs of September 28th at 1.3190. If USD/CAD continues to move lower, price can fall to the 61.8% Fibonacci retracement level from the same timeframe at 1.3004.
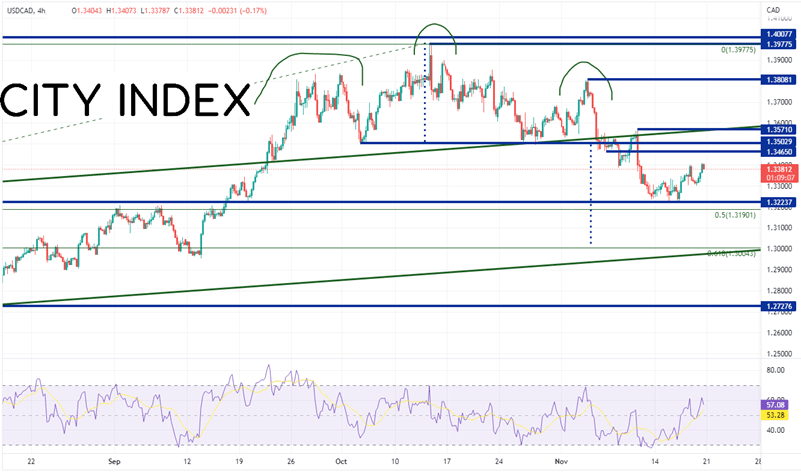
Source: Tradingview, Stone X
As the recent data has shown, inflation is still high in Canada. However, USD/CAD doesn’t seem to care too much. The pair has a strong negative correlation to the S&P 500. Therefore, if the S&P 500 continues to bounce higher, USD/CAD should move lower. Keep an eye on the neckline of the head and shoulders pattern at 1.3503. If price trades above there, the pattern is invalidated.
Learn more about forex trading opportunities.
Latest market news
Yesterday 01:32 PM
Yesterday 09:35 AM
Yesterday 07:23 AM
Yesterday 04:48 AM
Yesterday 12:17 AM
July 25, 2024 10:39 PM
Latest Trade Ideas articles

Yesterday 09:35 AM

Yesterday 12:17 AM

July 25, 2024 10:39 PM

July 25, 2024 05:30 PM