August 19, 2022 3:40 PM
UK Retail Sales for July were better than expected at +0.3% MoM vs -0.2% MoM expected and -0.2% MoM in June. In addition, Retail Sales ex-fuel were +0.4% MoM vs and expectation of -0.2% MoM and +0.2% MoM in June. This was the highest reading for the print since October 2021 and was the only bright spot for UK data this week. Inflation climbed to double digits at 10.1% YoY. In addition, the Claimant Count Change for July was only -10,500 vs -26,800 the previous month and Gfk Consumer Confidence for August was -44 vs -41 in July. This print was a new record low! However, fears of recession with higher inflation are weighing on the minds of collective traders and investors, sending GBP/USD lower.
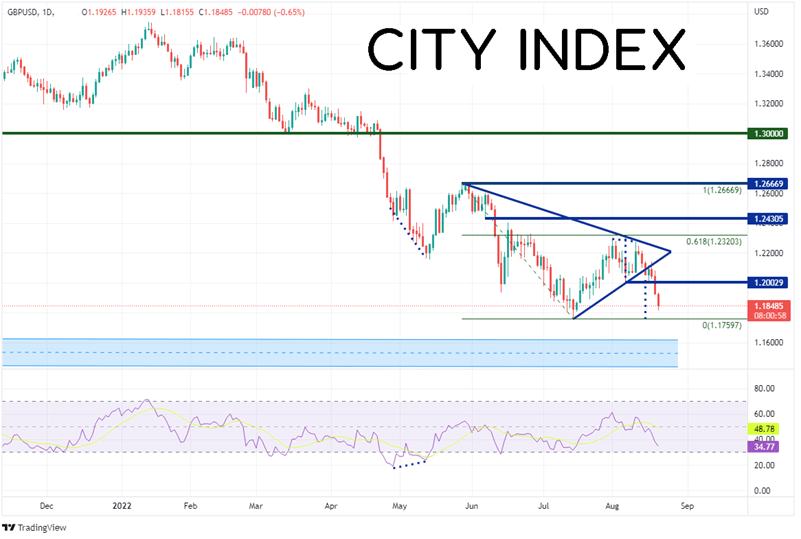
GBP/USD began its move lower in June 2021 as price was at a high of 1.4250. In April, the pair fell aggressively through the psychological round number support level of 1.3000. GBP/USD reached a local low at 1.2155, before bouncing to 1.2660 as the RSI and price were diverging. The pair the traded in a symmetrical triangle, which is considered a continuation pattern. As price neared the apex, it formed a double top. Price broke below the symmetrical triangle on August 15th near 1.2100. A few days later, on August 18th, the pair broke below the neckline of the double top at 1.2003. The target for a double top is the height of the pattern, added to the breakdown point. In this case the target is near the July 14th lows at 1.7587. However, the positive retail sales data today wasn’t enough to overcome the relentless US Dollar bid, and as a result, GBP/USD has fallen to its lowest level since July 15th.
Source: Tradingview, Stone X
Trade GBP/USD now: Login or Open a new account!
• Open an account in the UK
• Open an account in Australia
• Open an account in Singapore
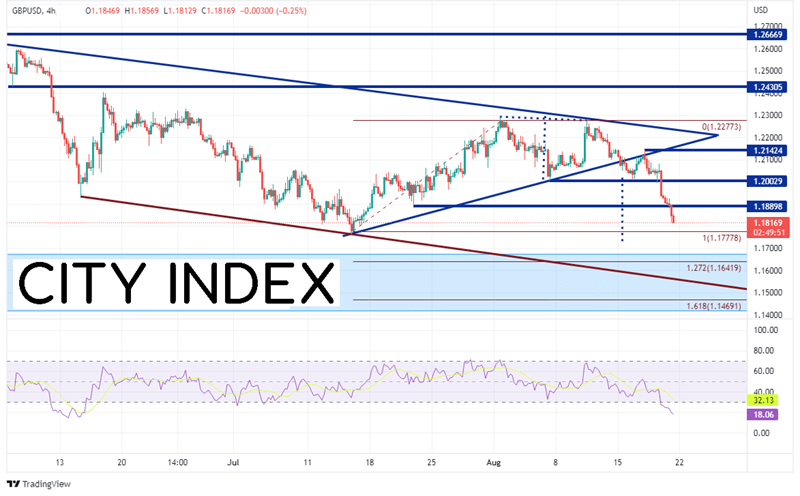
On a 240-minute timeframe, price moved aggressively lower once GBP/USD broke below the 1.2003 level. The first support isn’t until the lows of Jul 14th at 1.1760. Below there, the next support level is a wide-ranging band dating back to the pandemic lows in March 2020. The top of the band crosses at 1.1675. Additional support is found at the 127.2% Fibonacci extension from the lows of July 14th to the highs of August 1st at 1.1642, then a downward sloping trendline dating back to January 14th near 1.1560. However, notice that the RSI is in oversold territory, indicating that the pair could be in for a near-term correction. First horizontal resistance is at the July 21st lows of 1.1890, followed by the previously mentioned 1.2003. Above there, GBP/USD can move up to previous highs at 1.2152.
Source: Tradingview, Stone X
The July UK sales data was much better than expected. However, with the worse inflation data and employment data this week, combined with a strong US Dollar, couldn’t hold up GBP/USD and the pair may be headed for its lowest level since July 14th! Keep an eye on the PMI Flash due out on Tuesday for clues as to if the economy is starting to strengthen, or if it will fall below the 50 expansion/contraction level!
Learn more about forex trading opportunities.
Latest market news
Today 07:49 AM
Yesterday 01:39 PM
Latest Trade Ideas articles

Today 07:49 AM