

- S&P 500 analysis: Investors interpret Fed as slightly less hawkish than expected
- Apple expected to report 10% decline in iPhone sales
- NFP and ISM services PMI to come on Friday

After closing well off their highs on Wednesday in response to the latest US monetary policy decision and Powell’s remarks at the FOMC presser, Wall Street has so far been on the front-foot with major indices trading in the positive territory. However, it remains to be seen whether the markets will find comfort from the Fed’s indication of no imminent interest rate hikes, and Apple's upcoming earnings results tonight, before the focus turns to the key US monthly jobs report and the ISM services PMI at the end of the week.
Coming up: Apple earnings
Meanwhile, today’s attention will be on Apple’s earnings after the markets close. The tech giant is expected to report its biggest quarterly revenue decline in more than a year, with sales of the iPhone seen falling in excess of 10% in Q1 thanks to strong competition in China. The company’s EPS is expected to be around $1.50 on revenue of $90.3 billion. If correct, it would represent a 4.75% year-on-year revenue decline. The share price of Apple has under-performed in recent months, reflecting in part concerns about Chinese demand for iPhone. Would the company confound expectations, though?
S&P 500 analysis: Investors interpret Fed as slightly less hawkish than expected
Following the Fed’s meeting, investors are left scratching their heads. Powell quashed expectations of a rate hike this year, but he also indicated that the central bank was in no rush to start cutting interest rates – something that was widely expected anyway. Still, the fact that the market is now pricing in 35 basis points of cuts this year, which is slightly higher than prior to the meeting, this suggests that investors have interpreted the lack of change in forward guidance as a lean towards a more dovish stance from the Fed.
However, ongoing concerns about persistent inflationary pressures that have been reflected in various economic indicators remain. Those concerns could intensify if incoming data remains strong, especially wages and inflation.
What will traders be watching for the rest of the week?
Further insights into inflationary pressures and the state of the US economy will be gleaned from the April non-farm payrolls data scheduled for release on Friday. Analysts expect the unemployment rate to have remained unchanged at 3.8% with a headline non-farm payrolls gain of 238,000 and a 0.3% rise in average hourly earnings. If correct, that would suggest hiring remains too hot for the Fed to consider rate cuts in the coming months.
Recent robust growth data and persistently high inflation figures have tempered expectations of rate cuts in 2024. But while hard data has been strong, we have seen soft survey-based figures, pointing to weakness. It is also possible that the extent of hawkish repricing may already be priced in. Therefore, any signs of weakness in US employment or wages data could alleviate concerns about the Fed's capacity to lower rates, leading to a potential rebound in equity markets
Meanwhile, the ISM services PMI will be released a couple of hours after the NFP data. Last week, the S&P Global PMI data showed US business activity increased at a sharply slower pace April amid signs of weaker demand. Its services PMI showed the weakest reading in 5 months as orders fell and companies responded by scaling back employment. If this is anything to go by then the closely watched ISM survey could disappoint expectations and potentially lead to some dovish repricing of Fed interest rates.
S&P 500 analysis: Technical levels and factors to watch
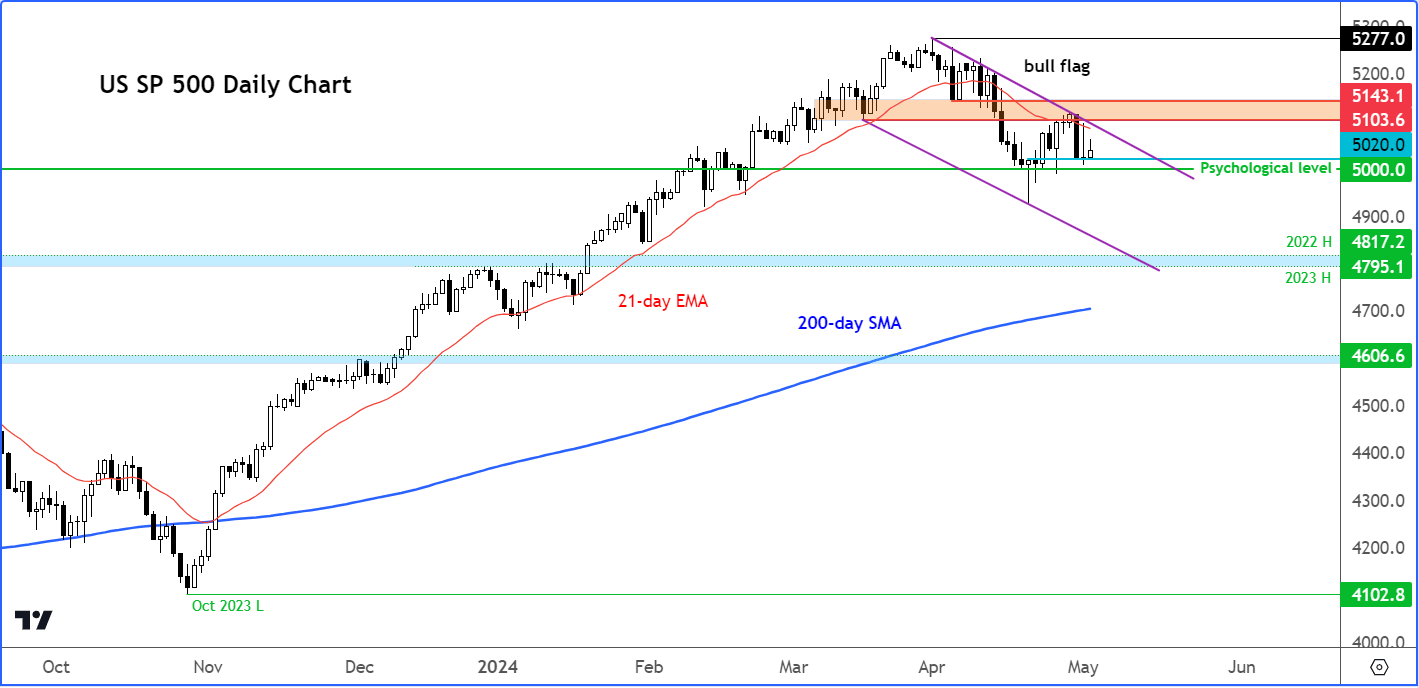
Source: TradingView.com
Stocks rallied then slumped during the FOMC press conference, causing the S&P 500 and other major indices to close the session with doji-like candles on their daily charts. The doji candles point to indecision, which is hardly surprising given the mixed messages that Powell delivered – quashing expectations of another rate hike, yet also suggesting that they will be in no rush to cut rates.
Anyway, all the major US indices remained below their respective 21-day exponential moving averages, objectively suggesting that the bulls are not out of the woods yet. That may change soon, but until we see a confirmed signal to suggest the correction phase is over, the bulls must proceed with extra care.
The S&P may remain inside its consolidation pattern for several weeks, or even drop out of it, given that we have just entered the month of May, which traditionally has not been a great month for the markets.
Thus, I wouldn’t rule out the potential for a deeper correction, perhaps to the long-term support area in the range between 4795 to 4817. This is where the index had formed its highs in the last two years.
For now, all eyes are on support around 5000 to 2020. A closing break below this range could pave the way for a drop towards last week’s low at 4925. The next support area is the lower trend of the bull channel around 4850/60, followed by the aforementioned 4795-4817 range.
On the upside, key resistance comes in from around 5100, which corresponds with the resistance trend of the bull flag. A move above this area would be deemed a bullish scenario.
-- Written by Fawad Razaqzada, Market Analyst
Follow Fawad on Twitter @Trader_F_R
How to trade with City Index
You can trade with City Index by following these four easy steps:
-
Open an account, or log in if you’re already a customer
• Open an account in the UK
• Open an account in Australia
• Open an account in Singapore
- Search for the company you want to trade in our award-winning platform
- Choose your position and size, and your stop and limit levels
- Place the trade
Latest market news
Yesterday 01:32 PM
Yesterday 09:35 AM
Yesterday 07:23 AM
Yesterday 04:48 AM
Yesterday 12:17 AM
July 25, 2024 10:39 PM
Latest Stocks articles

July 18, 2024 11:35 AM

June 13, 2024 02:00 PM

June 6, 2024 02:00 PM
June 2, 2024 08:00 AM