

The Jury remains out as to whether the Fed will cut in June or not. Economists and Fed fund futures backed a 25bp cut at their June 12th meeting, but I remain less convinced looking at the latest CPI report. Core CPI remains nearly twice the Fed’s 2% target and the monthly core CPI and CPI prints remain elevated at 0.4% and above their long-term averages. The numbers are not what I would call a disaster as it is reasonable to expect monthly fluctuations throughout the cycle, but it should come as a disappointment for those expecting more cuts to begin sooner.
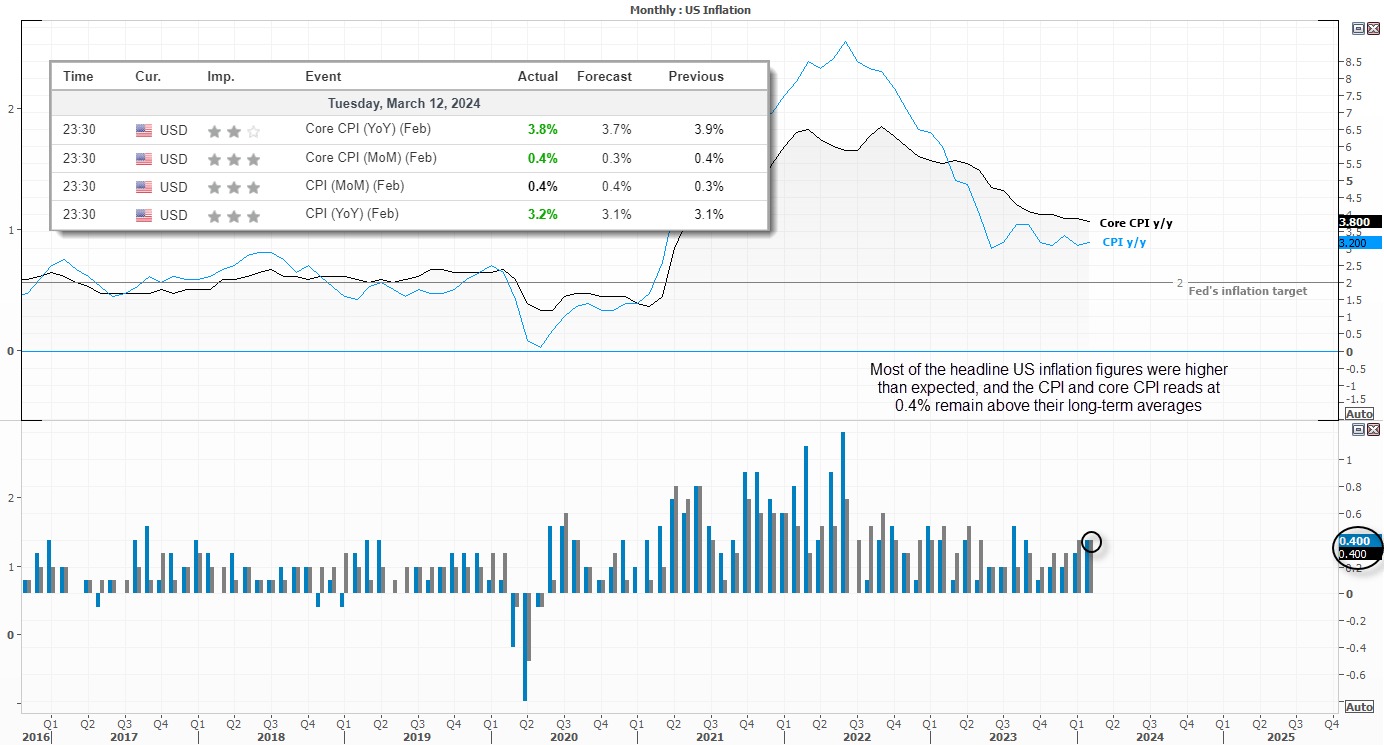
Still, if there is a glimmer of hope for doves, it’s that Powell did actually mentioned cuts last week during his testimony to the House Committee. Traders will now want clarity over Powell’s stance, as he either needs to get behind ‘potentially talking about them’ or walk it back. Again. But with Fed fund futures implying a 62.4% chance of a June cut, they seem to be looking past this month’s CPI as a blip.
Market Summary:
- Small-business optimism also came in softer than the US than expected, adding to hopes of an earlier Fed cut
- Yet Wall Street indices did the usual and danced to their own beat, with surge of Oracle’s share price seeing the Nasdaq lead the way higher and the S&P 500 rise to just 14 points below its all-time high
- The US dollar rose for a second day, although the USD index failed to hold above 103 and formed an inverted hammer on the daily chart, and EUR/USD closed flat with an indecision day
- US yields put up a more impressive show than the US dollar, with the 2-year rising above its 200-day EMA.
- USD/JPY snapped a 5-day losing streak and formed a 3-day bullish reversal pattern
- AUD/USD retraced to a 3-day low and formed an indecision day, and its daily low respected the 00-day EMA
- GBP/USD fell for a second day after weaker UK wages and employment data brought forward bets of a BOE cut, with some now calling for 100bp of cuts and for the central bank to begin before June
Events in focus (AEDT):
- 08:45 – New Zealand food price inflation
- 18:00 – UK industrial production, manufacturing production, index of services, GDP m/m, trade balance
- 19:00 – China loan growth, social financing

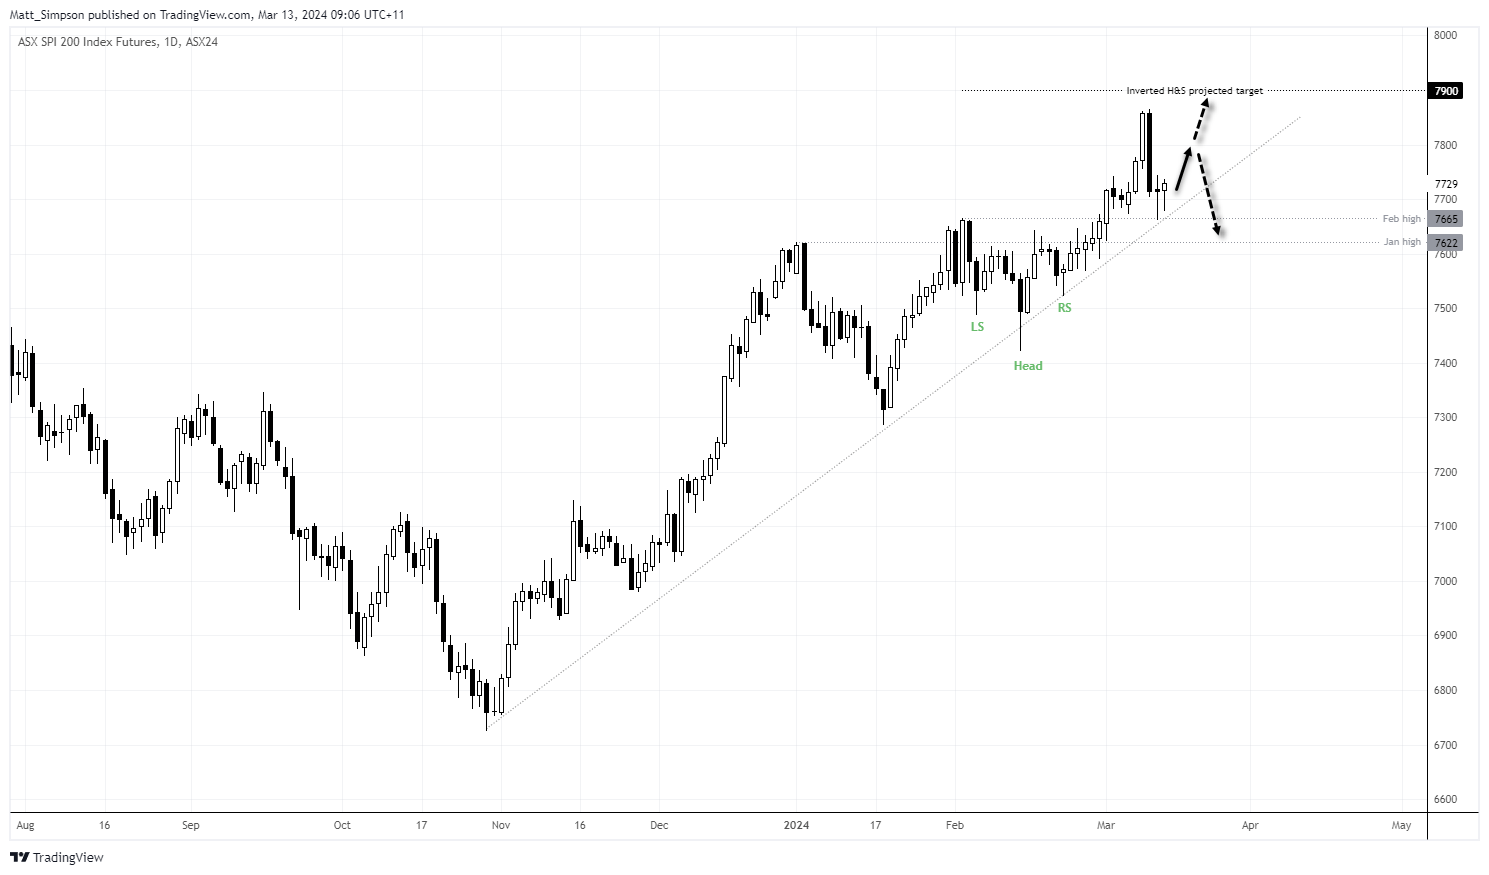
ASX 200 technical analysis:
The Australian market failed to track Wall Street higher with much enthusiasm overnight, looking at ASX 200 futures. But that doesn’t mean it cannot try and catch up today. A doji formed at the bullish trendline and above the February high, and the current day’s low is above the doji low. Furthermore, the 7900 target from the inverted head and shoulders pattern remain in play. The bias remains bullish above the 7600, although 7660 could also be used as a cutoff point for tighter risk management.
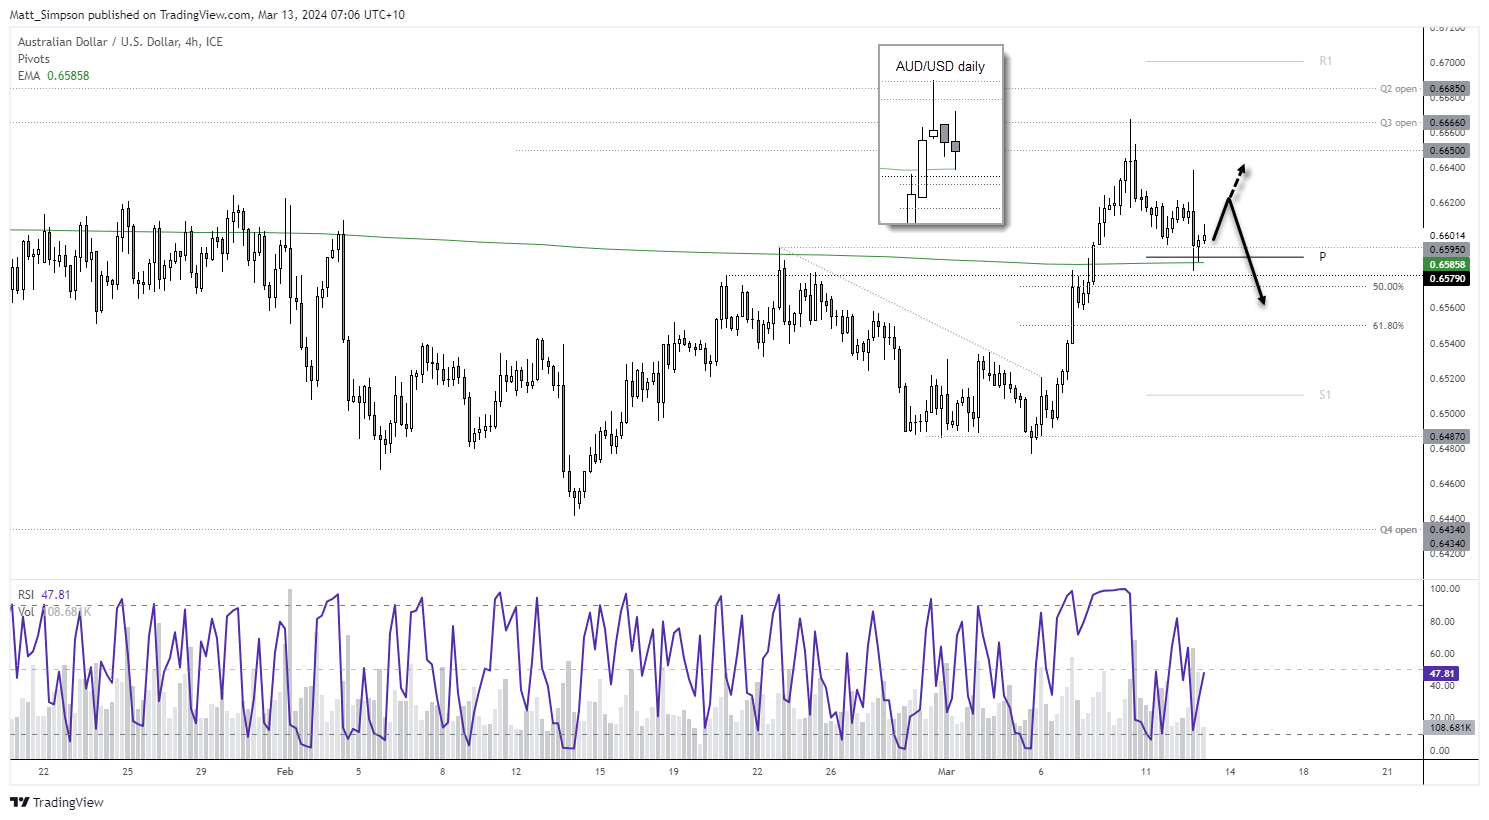
AUD/USD technical analysis:
The Australian dollar played nicely with yesterday’s bias for an initial bounce ahead of its next leg lower. Yesterday’s doji respected the 200-day EMA, so another small bounce is due. A bullish divergence on RSI (2) has formed on the 4-hour chart, and the prior two candles closed back above the weekly pivot point, following false breaks of it. So today’s bias is a repeat of yesterdays; I suspect another bounce could be due – even if the risk of a break below the 200-day EMA remains. US yields put up a better show than the US dollar yesterday, so I am not convinced the USD correction higher has fully played out.
Bulls may want to seek dips towards the weekly pivot point for a move towards 0.6620. Although it remains up in the air as to whether there is enough appetite for it to simply break above the 4-hour bearish engulfing candle initially, given the lack of news in Asia today.
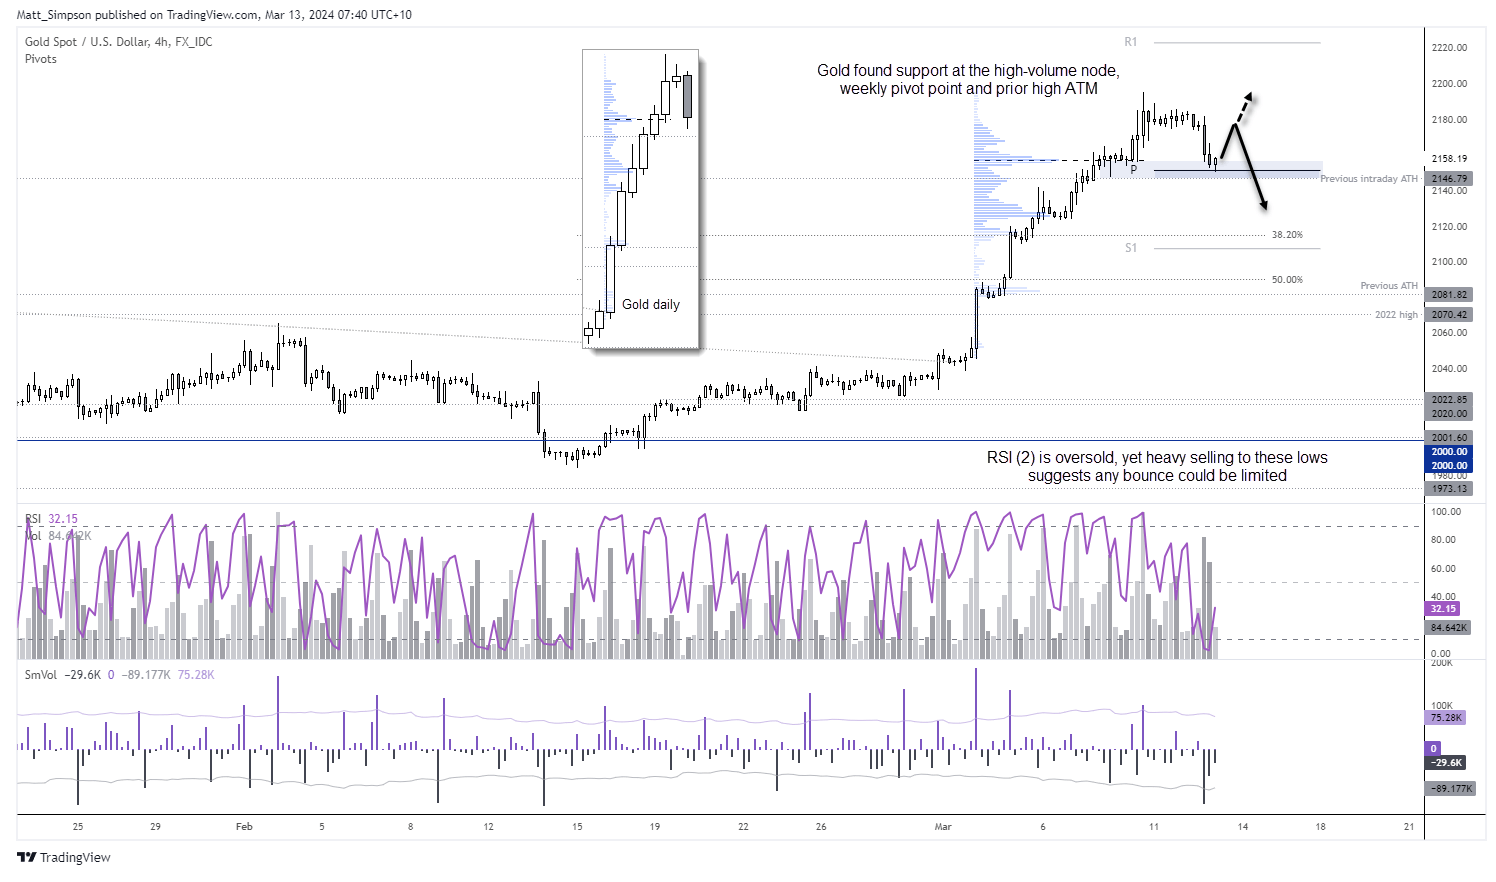
Gold technical analysis:
US CPI data was too much for gold bugs to bear after a 9-day rally to its latest record high. It formed a bearish engulfing day which itself could be part of a 3-day reversal (evening star formation). The 4-hour chart shows prices pulled back nicely into the support zone around the weekly pivot point, previous record high and high-volume nide. Given RSI (2) is oversold then, like AUD/USD, I suspect a bounce could be due today.
View the full economic calendar
-- Written by Matt Simpson
Follow Matt on Twitter @cLeverEdge
How to trade with City Index
You can trade with City Index by following these four easy steps:
-
Open an account, or log in if you’re already a customer
• Open an account in the UK
• Open an account in Australia
• Open an account in Singapore
- Search for the market you want to trade in our award-winning platform
- Choose your position and size, and your stop and limit levels
- Place the trade
Latest market news
April 25, 2024 03:09 PM
April 25, 2024 03:00 PM
April 25, 2024 01:12 PM
April 25, 2024 11:14 AM
Latest Asian Open articles

April 23, 2024 11:09 PM

April 22, 2024 10:48 PM

April 18, 2024 11:27 PM

April 17, 2024 11:16 PM