- ECB remain on track for multiple rate cuts this year, despite the likelihood of no cuts from the Fed and an expansive Middle Eastern conflict. Whilst there is division among the ranks of ECB officials between two or three cuts this year, Christine Lagarde has kept the door open for a June cut.
- A Reuters poll saw 59 of 97 economists estimate 75bp or less of ECB cuts this year, or 38 or 100 at 100bp or less. A June cut is almost fully backed by 97 or 97 economists.
- Regardless, EUR/USD remains flat on Monday and formed a small inside day whilst the US dollar ponders its next move (but to my eyes looks like it wants to pop higher over the near term, towards the 1.07 area).
- GBP/USD fell to a fresh YTD low on bets the BOE will now cut twice this year, beginning in August
- Wall Street indices were a touch higher allowing the S&P 500 to snap a 6-day losing streak, the Dow Jones rise to a 5-day high and the Nasdaq hold above 17k and form an inside day / spinning top doji
- USD/JPY trades less than 20-pips from 155, a level not tested since 1990. The question now is if we’ll see a clean break or the market will naturally selloff if this key level is tested.
- AUD/USD formed a small bullish engulfing day after Friday’s false break of 64c left a bullish pinbar – the bias remains for a bounce towards 0.6470 – 0.6500
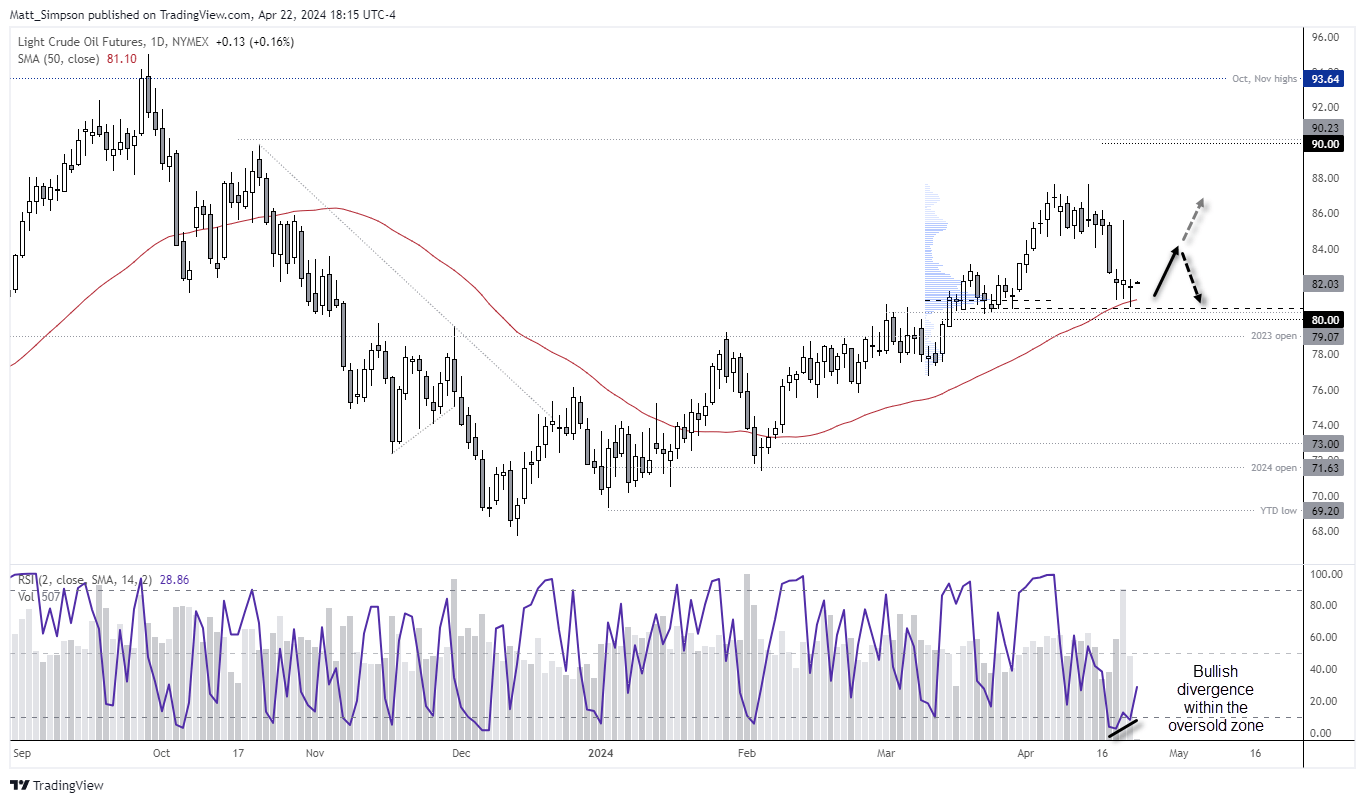
- Crude oil looks comfortable above $80 and I suspect a bounce towards $84 could be on the cards (see below for today’s chart)
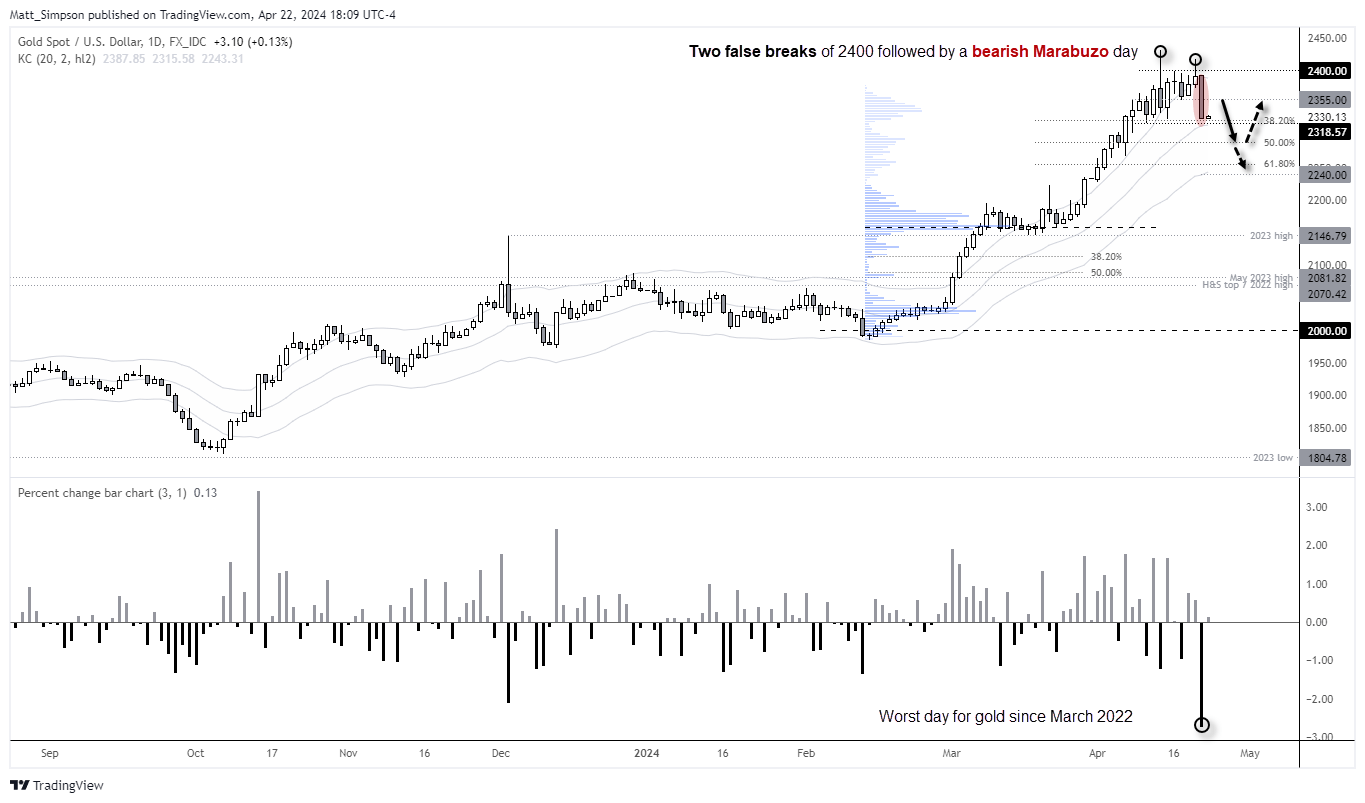
- Gold prices suffered their worst day since March 2022 to suggest we may have entered the early stages of a retracement.
Economic events (times in AEST)
- 09:00 – Australian flash PMIs (manufacturing, services)
- 10:30 – Japan’s PMIs (manufacturing, services)
- 15:00 – Singapore inflation
- 17:15 – France flash PMIs (manufacturing, services)
- 17:30 – Germany flash PMIs (manufacturing, services)
- 18:00 – Euro area flash PMIs (manufacturing, services)
- 18:30 – UK flash PMIs (manufacturing, services)
- 21:15 – BOE member Pill speaks
- 22:00 – US building permits
- 23:45 – US flash PMIs (manufacturing, services)
Gold technical analysis:

Just one day down, gold is already on track for a bearish engulfing week which opened at the high and closed the day at the low. The weekly RSI (14) had reached its highest overbought level since August 2020 with a reading of 80. And, as noted in the weekly COT report, managed funds and large speculators trimmed long exposure last week with managed funds increasing their short exposure for a second week.
The daily chart shows that the nice bullish trend from the $2000 area has seen a shakeup at the highs. Monday’s bearish engulfing candle was its worst day in nearly two years, forming a bearish Marabuzo candle (no upper or lower wicks). Whilst this could spook more bulls into booking profits and potentially sending gold lower, support has been found around the 20-day EMA and 38.2% Fibonacci level. Should prices bounce, I’d be looking for evidence of a swing high around 2355 – near the centre of the Marabuzo candle, in anticipation of a break lower and move towards the 50% and 61.8% retracement levels (the latter sits near the lower Keltner band) around $2240.
WTI crude oil technical analysis:

The retracement from the April high has seen crude oil prices hand back nearly 8%, which alone is enough to suspect a bounce higher could be due. And this seems more likely than not, given support has been found around a previous consolidation area, high-volume node, $80 and 50-day MA. Furthermore, a small bullish divergence has formed on the RSI (14) within the oversold zone, hence the hunch for a swing low and bounce towards $84.
Beyond that, things become murky. On one has managed funds are increasing their short bets against crude oil and on the other the potential for Middle East headlines to at least support (if not boost) oil prices. For now, I’ll stay in my lane and seek some bullish mean reversion form a technical perspective.
View the full economic calendar
-- Written by Matt Simpson
Follow Matt on Twitter @cLeverEdge
How to trade with City Index
You can trade with City Index by following these four easy steps:
-
Open an account, or log in if you’re already a customer
• Open an account in the UK
• Open an account in Australia
• Open an account in Singapore
- Search for the market you want to trade in our award-winning platform
- Choose your position and size, and your stop and limit levels
- Place the trade


