


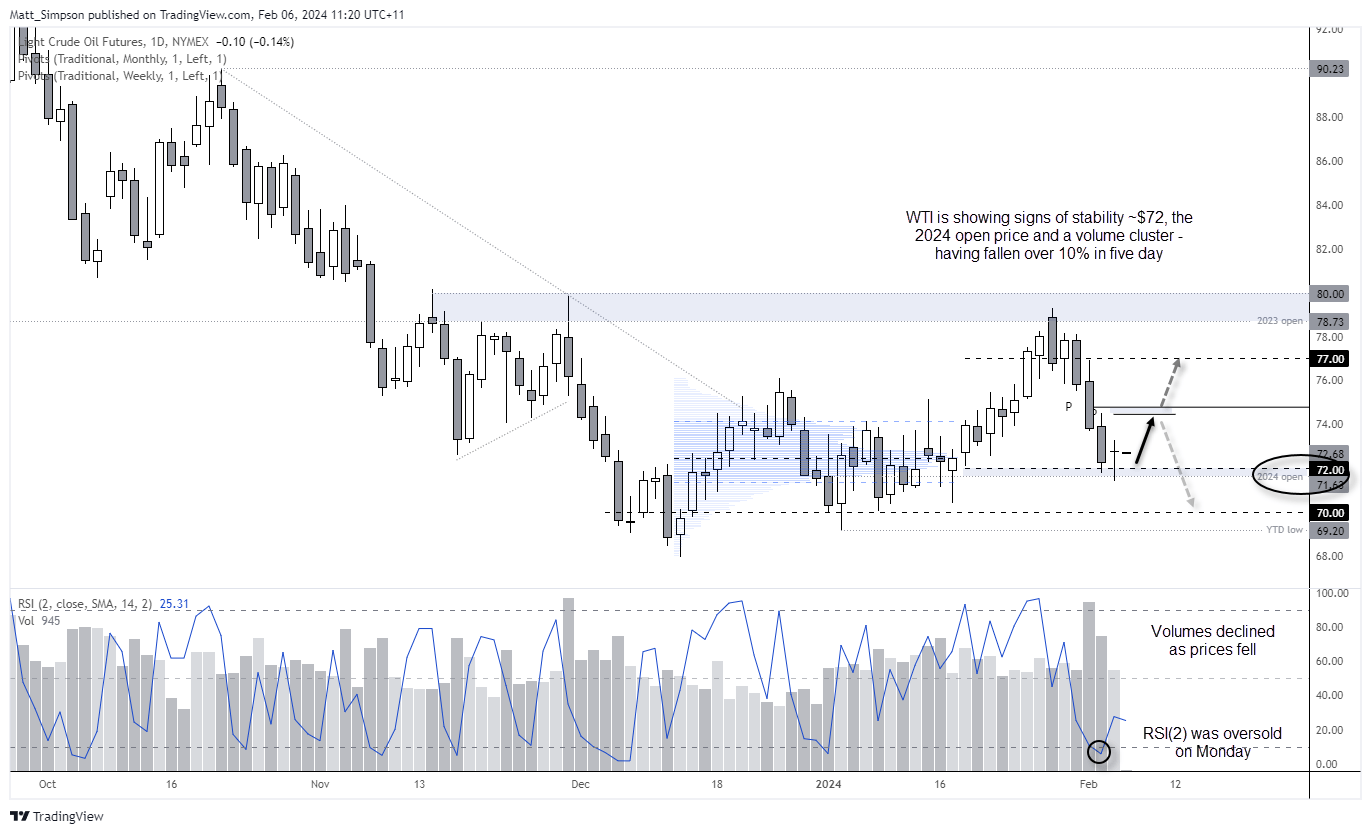
Crude oil prices fell over 10% in just five days, from the Jan 29th high to Monday’s low. That stat alone could be enough to convince me that a bounce seems statistically more likely than it continuing to fall further from here. But there are other technical clues which suggest WTI crude oil could be set to bounce.
WTI technical analysis (daily chart):
Crude oil futures saw a high-volume candle on Thursday around the midway point of the decline, and daily volume fell over the next two days. A doji formed on Monday which was also the smallest daily range of the decline, which further suggests bears are running out of steam.
However, the doji closed back above the $72 handle and 2024 open prices after a false break beneath them. There is also a volume cluster around $72.40 in the previous consolidation zone, which suggests institutions were slowly building up their long exposure.
From here, any low-volatility retracements within Monday’s range could prompt bulls to buy dips. A clear breach of Monday’s low could be a sign that the bullish bias has been invalidated. A move towards the weekly and monthly pivot points between 74.53 – 74.83 makes a viable interim target, a break above which brings $77 back into focus.
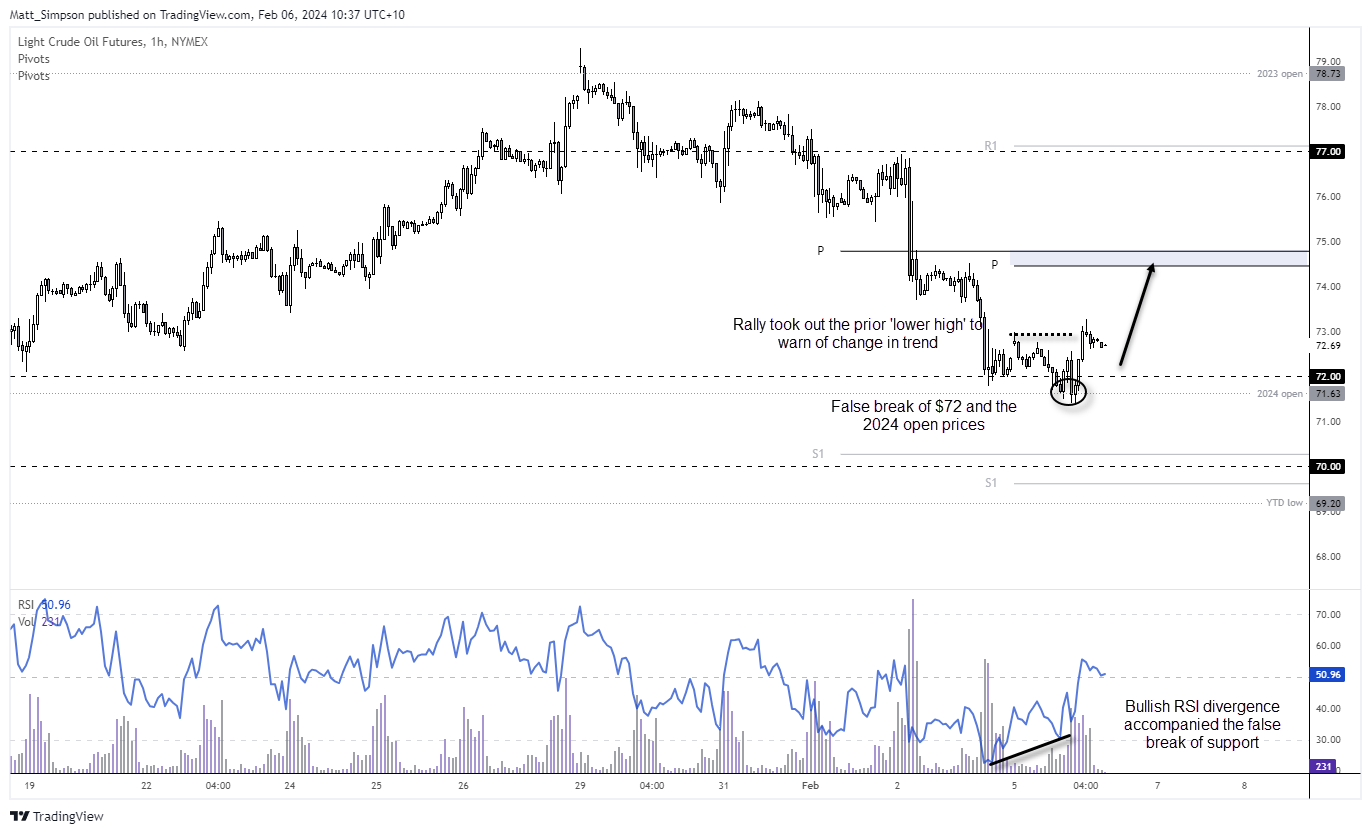
WTI technical analysis (1-hour chart):
A bullish divergence has formed on WTI crude oil’s 1-hour chart. Prices have also taken out the prior ‘lower high’ after a false break of the $72 and 2024 open price. From here, dips towards $72 look appealing for the anticipated move towards the weekly and monthly pivot points.
-- Written by Matt Simpson
Follow Matt on Twitter @cLeverEdge
How to trade with City Index
You can trade with City Index by following these four easy steps:
-
Open an account, or log in if you’re already a customer
• Open an account in the UK
• Open an account in Australia
• Open an account in Singapore
- Search for the market you want to trade in our award-winning platform
- Choose your position and size, and your stop and limit levels
- Place the trade
Latest market news
Yesterday 01:32 PM
Yesterday 09:35 AM
Yesterday 07:23 AM
Yesterday 04:48 AM
Yesterday 12:17 AM
July 25, 2024 10:39 PM
Latest Trade Ideas articles

Yesterday 09:35 AM

Yesterday 12:17 AM

July 25, 2024 10:39 PM

July 25, 2024 05:30 PM