


January 27, 2022 4:58 PM

The first look at the Q4 2021 GDP showed that the economy grew at a pace of 6.9% vs 5.5% expected and only 2.3% for Q3. However, this is a backwards looking number and many traders don’t take too much new information away from this economic data print. However, one important piece of information to look at in the GDP data is the inflation component, which is called the Price Index or the Deflator. The index rose to 7% vs an expectation of 6% and a 5.9% reading in Q3. The other price of data to look at from Thursday is the Advanced Q4 Personal Consumption Index (PCE) and the core PCE. The headline print was 6.5% vs 5.4% expected and 5.4% in Q3. The Core PCE (the Fed’s favorite measure of inflation) was 4.9%, as expected. However, this was higher than the Q3 reading of 4.6%. On Friday, monthly PCE will be released for December. The headline expectation is for 5.9% vs 5.7% in November. Note that the November reading was the highest in 39 years! The core reading is expected to be 4.8% vs 4.7% in November.
Forecasting 2022 inflation: Transitory no more?
Powell warned markets yesterday that the main concern for the Fed is that inflation will remain higher than expected for longer than expected. He added that there has not been progress on the supply chain issue (which increases inflation). A high GDP Price Index and Core PCE won’t help to ease those worries. Powell said that the committee is of the mind to raise rates at the March meeting. If inflation remains persistently high ahead of the next meeting, it may become a question of “how much” rather than “when” will they raise rates!
Central Banks: Liftoff in Focus?
After the hawkish press conference from Chairman Powell yesterday, the US Dollar Index (DXY) took off higher. It had already been going bid since failing to break below the bottom trendline of the upward sloping channel the index had been in since May 2021. Today, the DXY broke above previous highs at 96.90 and is flirting with resistance at the top trendline of the channel near 97.30. The next resistance level is at the 127.2% Fibonacci extension from the highs of December 15th 2021 to the January 13th lows, near 97.52. Above there is a confluence of resistance at the 161.8% Fibonacci extension from the same timeframe and horizontal resistance from the spring of 2020 near 98.28. Support is at the breakout level of 96.90 and then the gap fill below today’s low at 96.48. The 50 Day Moving Average acts as the next level of support near 96.06.
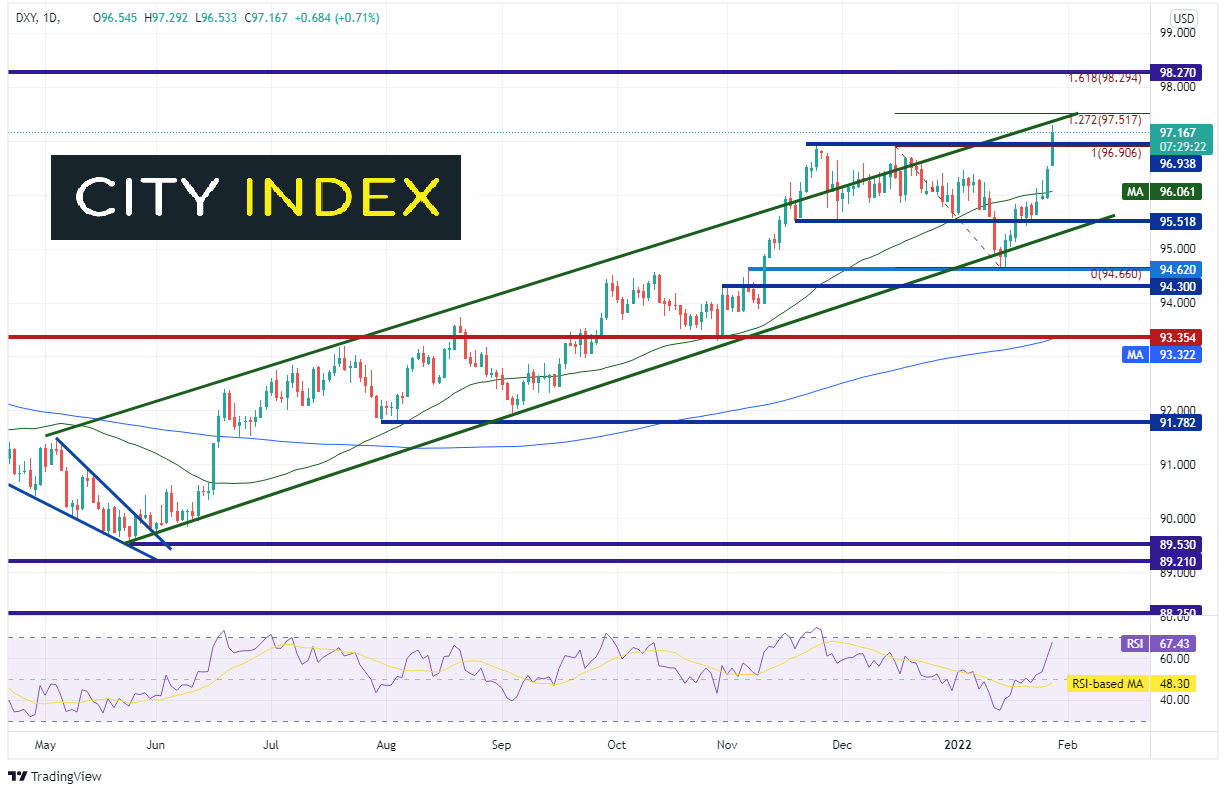
Source: Tradingview, Stone X
Although the GDP data is backwards looking, it cements the Fed’s view that inflation is stronger than it had anticipated and may be around longer than expected. With that in mind, Fed Chairman Powell set the stage for a rate hike in March. It now seems to be all about the inflation data moving forward to the next meeting in March!
Learn more about forex trading opportunities.
Latest market news
Yesterday 01:32 PM
Yesterday 09:35 AM
Yesterday 07:23 AM
Yesterday 04:48 AM
Yesterday 12:17 AM
July 25, 2024 10:39 PM
Latest Forex articles

Yesterday 12:17 AM

July 25, 2024 10:39 PM

July 25, 2024 03:59 PM

July 25, 2024 04:37 AM