


September 15, 2022 4:47 PM

The US released a trove of economic data this morning and the prints were mixed, resulting in muted market movement. US Retail Sales for August were +0.3% vs an expectation of 0% and a lower revised print of -0.4% for July. However, the ex-Autos component was -0.3% vs an expectation of 0.1% and a revised print of 0%. This was the first decline in the ex-Autos component since December 2021. Therefore, much of the retail sales print this month was due to auto sales. The US also released regional manufacturing data for August. The NY Empire State Manufacturing Index for September was much better than expected at -1.5 vs and expectation of -13 and a prior reading of -31.3. However, the Philadelphia Fed Manufacturing Index for September was much worse than expected at -9.9 vs an estimate of +2.8 and a prior reading o +6.2. Most of the miss in the headline print was due to the softer employment, new orders, and prices paid components.
AUD/USD has been falling since February 2021, when the pair reached a high of 0.8007. On April 5th, 2022, the pair reached a local high of 0.7649 and has been forming lower highs since then. AUD/USD reached an intraday low of 0.6681 on July 14th and proceeded to bounce above a downward sloping trendline of 0.7128. Once price moved lower from there, a head and shoulders pattern formed and on August 31st, AUD/USD broke below the neckline of the pattern. The pair traded down to support, bounced and retested the neckline, and is moving lower once again. The target for a head and shoulders pattern is the height from the head to the neckline, added to the breakdown point from the neckline. In this case it is near 0.6600.
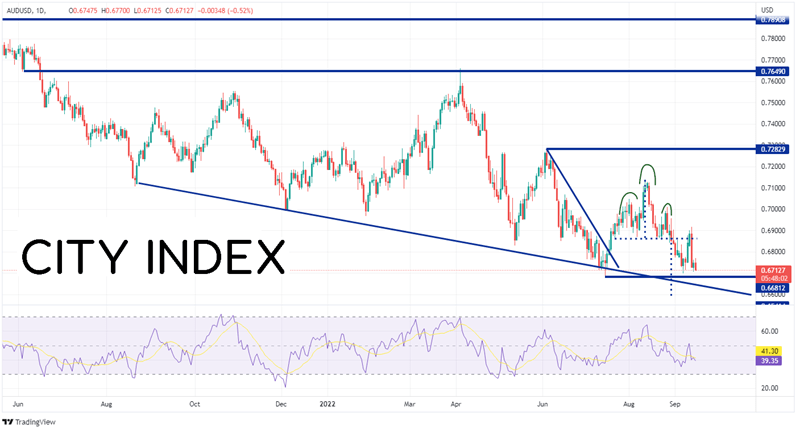
Source: Tradingview, Stone X
Trade AUD/USD now: Login or Open a new account!
• Open an account in the UK
• Open an account in Australia
• Open an account in Singapore
On a240-minute timeframe, AUD/USD has been in a short-term channel since price reached the previous highs at 0.7009. If the pair is to reach the target for the Head and Shoulders pattern, it must first pass through support at the July 14th lows of 0.6681 and then the bottom trendline of the channel near 0.6620. Below the 0.6600 target is support from April 2020 at 0.6570. If the July 14th lows hold, first resistance for AUD/USD is at the lows from September 12th near 0.6824. Above there is the upper trendline for the channel near 0.6850, then the highs from September 13th at 0.6916.
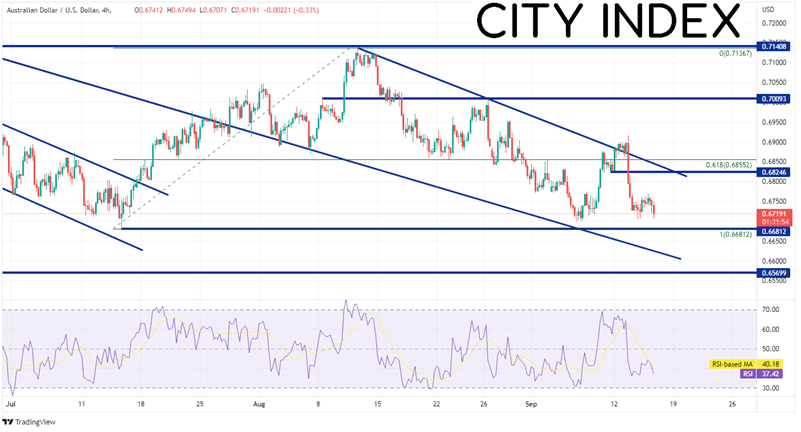
Source: Tradingview, Stone X
With mixed data from US Retail Sales, the Philly Fed Manufacturing Index, and the NY State Empire Manufacturing Index, the US Dollar has been quiet. Traders will now turn their attention to the Michigan Consumer Sentiment Index, particularly the inflation components. If the inflation data is higher than expected, markets will again start talking about a 100bps rate hike when the FOMC meets next week.
Learn more about forex trading opportunities.
Latest market news
Yesterday 01:32 PM
Yesterday 09:35 AM
Yesterday 07:23 AM
Yesterday 04:48 AM
Yesterday 12:17 AM
July 25, 2024 10:39 PM
Latest Trade Ideas articles

Yesterday 09:35 AM

Yesterday 12:17 AM

July 25, 2024 10:39 PM

July 25, 2024 05:30 PM