


January 26, 2023 4:48 PM
The US released at treasure trove of data earlier today, including Q4 GDP, December Durable Goods, and the Advanced Core PCE Prices for Q4. The Advanced GDP Growth Rate for Q4 was 2.9% vs an expectation of 2.6% and a prior reading of 3.2%. The GDP deflator (inflation component) was higher than expectations at 3.5% vs an estimated 3.3%. The prior reading was 4.4%. In addition, Durable Goods Orders for December were 5.6% MoM vs an expectation of 2.5% MoM and a prior reading of -1.7% MoM. However, Durable Goods Ex Transportation was -0.1% MoM vs -0.2% MoM expected and a November reading of 0.1%. It should also be noted that the Advanced Core PCE Prices for Q4 was 3.9% vs 4% expected and 4.7% in Q3. This suggests that tomorrow’s December Core PCE should be roughly in-line with expectations, as the December data is included in the Q4 Core PCE. Expectations are for 4.4% YoY vs a November reading of 4.7% YoY. What will the Fed think of this data? Probably not much as it is so long ago. The strong Durable Goods orders will be taken into consideration, along with the December Core PCE.
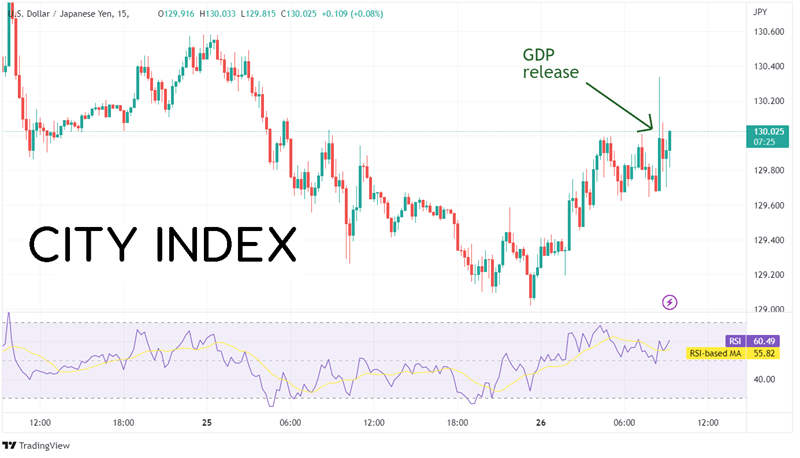
On the initial release of the data, USD/JPY spiked from 129.68 to 130.44. However, the bounce was used to sell the pair, as if moved back towards 130.00.
Source: Tradingview, Stone X
Trade USD/JPY now: Login or Open a new account!
• Open an account in the UK
• Open an account in Australia
• Open an account in Singapore
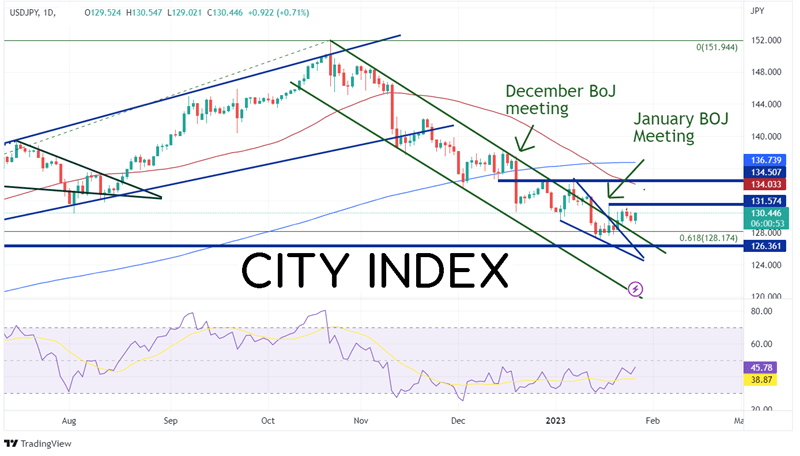
USD/JPY has been moving lower in an orderly channel since making 2022 highs on October 21st, 2022. The pair fell to the 61.8% Fibonacci retracement level from the lows of 2022 to the highs of 2022 near 128.17. At the beginning of 2023, USD/JPY began forming a descending wedge within the channel. The pair began to move sideways out of the wedge and the channel after the BoJ meeting on January 18th. Price has been oscillating between 127.56 and 131.57 since the meeting.
Source: Tradingview, Stone X
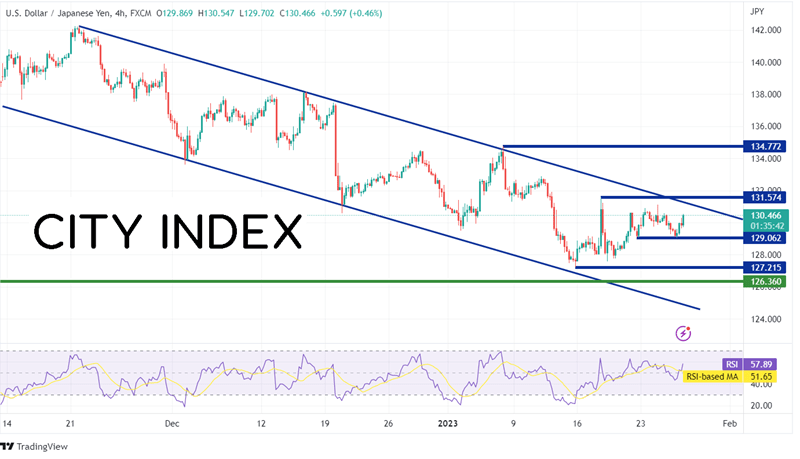
On a 240-minute timeframe, USD/JPY has made a tighter channel dating to mid-November 2022. If the pair continues to move now lower, first support is at the near-term double bottom at 129.06. Below there, price can move to the top trendline of the longer-term channel near 128.15 (see daily), then the lows of January 16th at 127.35. However, if the pair reverses and moves higher, first resistance is at the top trendline of the shorter-term channel near 131.25, then the highs of November 17th at 131.57. If price breaks above there, the next resistance level isn’t until the 50 Day Moving Average at 134.03 (see daily).
Source: Tradingview, Stone X
The US reported a host of economic data this morning, including Q4 GDP, December Durable Goods, and Q4 Core PCE. Although Durable Goods was stronger than expected, there is little to take from the other data points, as it was from so long ago. Watch December’s Core PCE on Friday, which will be a better indicator of the Fed’s decision next week.
Learn more about forex trading opportunities.
Latest market news
Yesterday 01:32 PM
Yesterday 09:35 AM
Yesterday 07:23 AM
Yesterday 04:48 AM
Yesterday 12:17 AM
July 25, 2024 10:39 PM
Latest Trade Ideas articles

Yesterday 09:35 AM

Yesterday 12:17 AM

July 25, 2024 10:39 PM

July 25, 2024 05:30 PM