


EUR/USD falls ahead of German GDP, US PCE
EUR/USD is falling for a fifth straight session. This week’s hawkish Fed and strong US GDP data boosted the USD to a 19-month high.
Today German GDP data is unlikely to lift the Euro. Economic growth in Germany is expected to have slowed in Q4 to 1.8%, down from 2.5% in Q3. Rising Delta cases, followed by surging Omicron cases, plus high energy prices are expected to have dampened growth.
Eurozone consumer confidence is also expected to confirm a slight deterioration in January to -8.5, from -8.4.
Across the pond US inflation data is expected to show the Fed’s preferred inflation gauge, core PCE rose to 4.8, up from 4.7%. High inflation data could lift the USD.
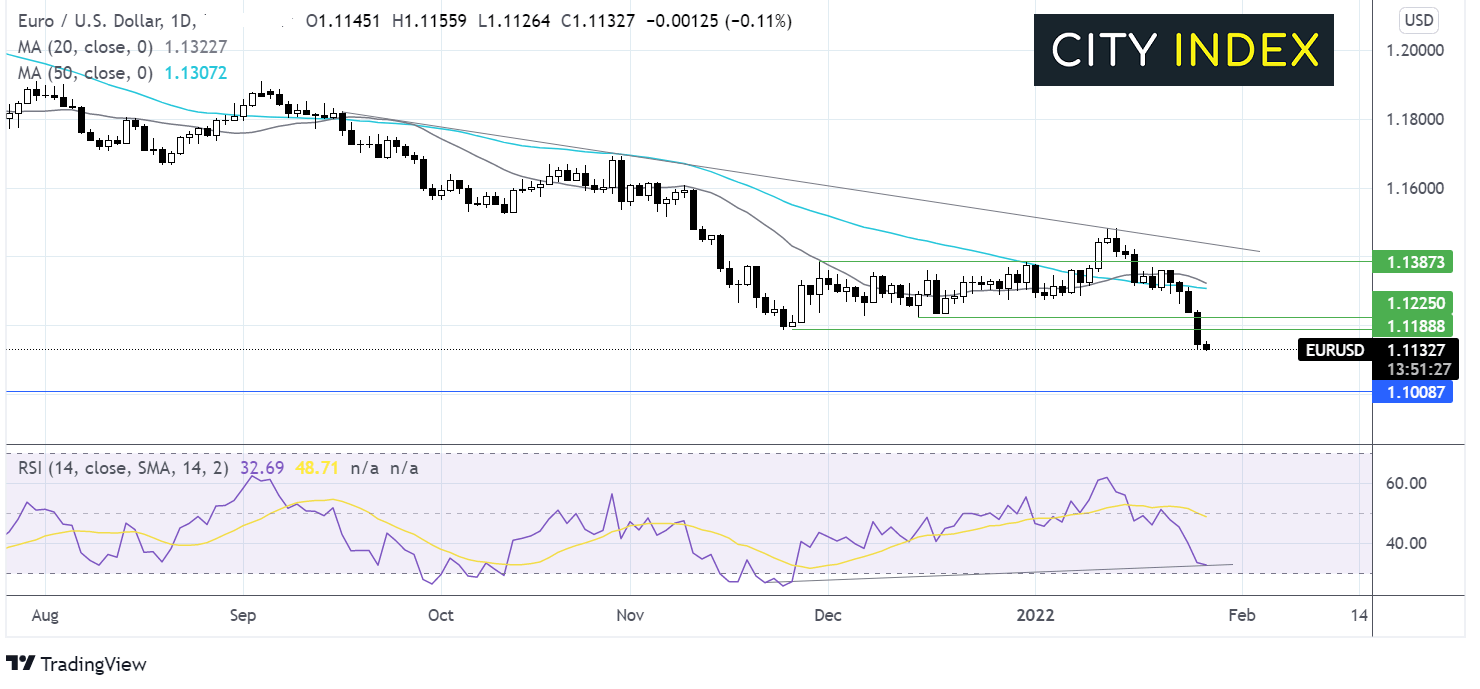
Where next for EUR/USD?
EUR/USD has been trending lower since early September. After rebounding lower off the falling trendline, EUR/USD closed below 1.1170 the November low. The RSI is showing a bullish divergence, which suggests that momentum is slowing and is sometimes seen before a reversal.
On the upside resistance can be seen at 1.1170 the November low ahead of 1.1230 the December low.
Should the price continue falling, bears could target 1.10.
Apple jumps 5% pre-market after strong results
Apple trades 5% higher pre-market after stellar numbers. Apple saw revenue in the last three months of 2021 hit another record high of $123.9 billion, up 11% from a year earlier, as its services business expanded and as chip shortages did less damage than feared.
Apple reported net profits of $34.6 billion , a 20% jump on the year before and well above the $31.1 billion forecast.
Supply chain issues cost the company $6 billion in missed sales, roughly the same as the prior quarter and better than the $10 billion supply headwinds expected.
iPhone sales were strong, accounting for 58% of total revenue, up from 47% a year earlier.
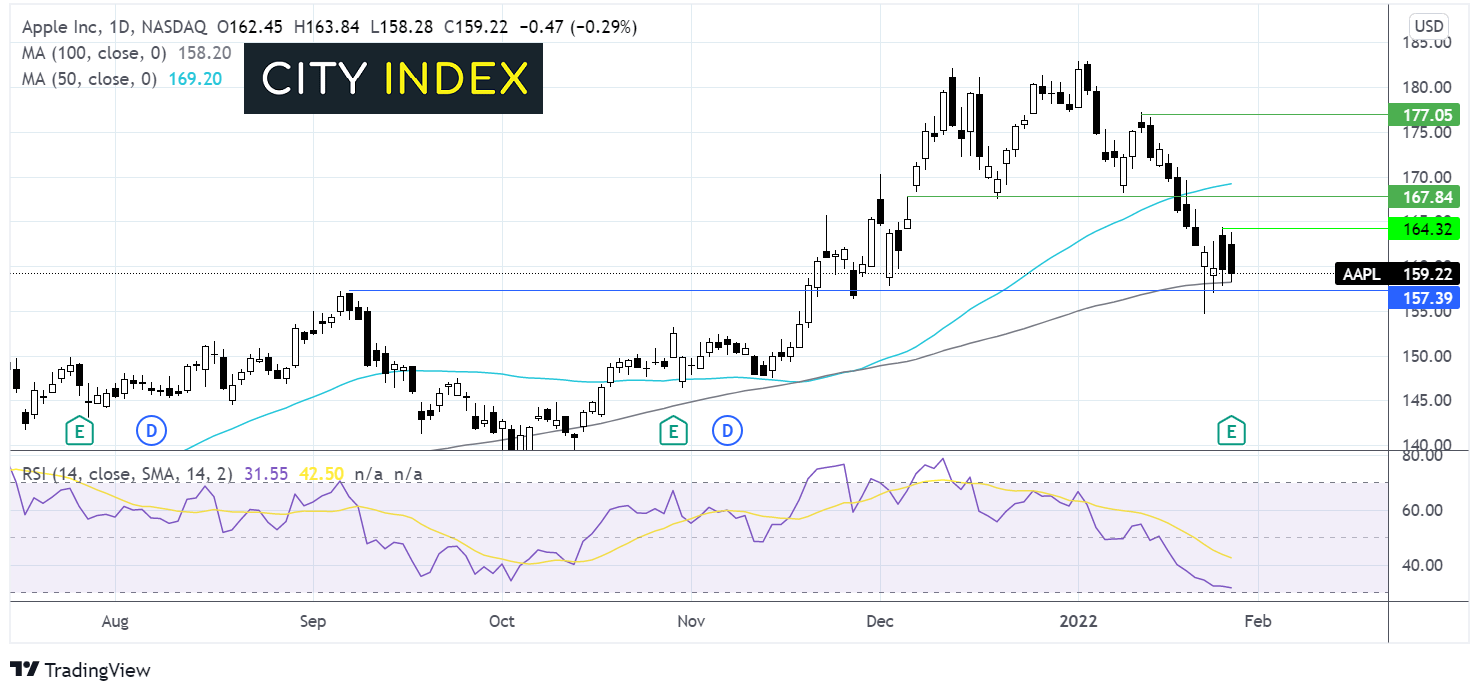
Where next for Apple share price?
Apple share price has found support on the 100 sma at $158 and is expected to rebound 5% higher on the open, which will take out resistance at $164, the key $168 support turned resistance, exposing the 50 sma at $169.00 and negating the near term down trend. It will take a move over $177 for the bias to turn bullish.
How to trade with City Index
Follow these easy steps to start trading with City Index today:
- Open a City Index account, or log-in if you’re already a customer.
- Search for the market you want to trade in our award-winning platform.
- Choose your position and size, and your stop and limit levels
- Place the trade.
Latest market news
Yesterday 01:32 PM
Yesterday 09:35 AM
Yesterday 07:23 AM
Yesterday 04:48 AM
Yesterday 12:17 AM
July 25, 2024 10:39 PM
Latest Forex articles

Yesterday 12:17 AM

July 25, 2024 10:39 PM

July 25, 2024 03:59 PM

July 25, 2024 04:37 AM